Figures & data
Figure 1. Treatment plan and treatment protocol. (A) Schematic representation of the CAR-133-CD137ζ chimeric T-cell receptor cDNA plasmid, not to scale. (B) Consort flow diagram of the clinical trial. (C) One standard cycle of CART-133 treatment procedure. CART-133 treatment for non-HCC patients included a chemotherapy pre-regimen (red dashed line).
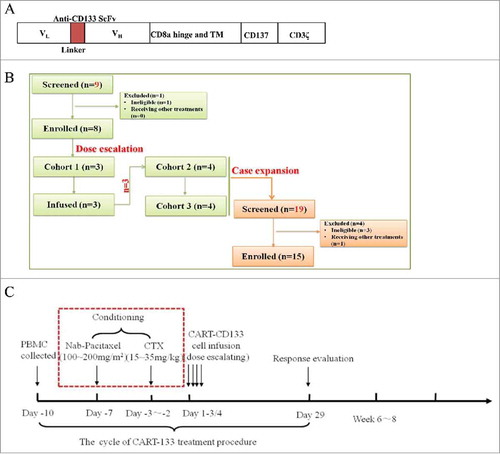
Figure 2. CART-133 cell dose escalation. (A) Dose group and CART-133 infusion cell dose pattern in all patients. (B) Hemoglobin (Hgb), reticulocyte, CD133+ cells and CAR-gene copy numbers in PB were detected before and at serial time points after CART-133 cell infusion in each patient from every cohort. (C) Tumor biomarkers in serum from each patient were detected before and at serial time points after CART-133 cell infusion. The blue dashed line on the plots is the normal range of each tumor biomarker. Red represents the increase, and green represents the decrease. N = cell infusion cycle; n = case number.
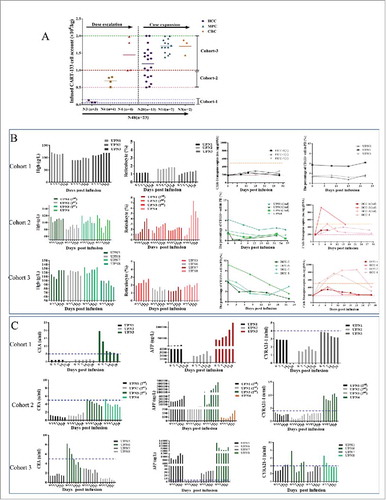
Figure 3. Safety of CART-133 cells. Cytokines from the serum of each patient's PB, which was collected before and at serial time points after cell infusion, was measured by fluorescence-activated cell sorting. The color shades represent different fold-changes with the baseline.
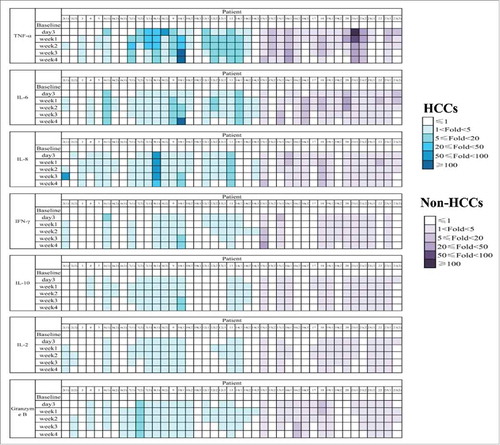
Table 1. Characteristics of patients (n = 23).
Figure 4. Response of CART-133 cells. (A) Maximum reduction in target lesion size after CART-133 cell infusion. PD: progressive disease, SD: stable disease, PR: partial remission. (B) Progression-free survival and overall survival by the Kaplan-Meier method. (C) Patients were divided into 3 groups based on response from the first cell infusion. PR + SD (lesion-regression), SD (lesion-progression), PD (progressive disease). Statistical analysis of PFS differences between the 3 groups.
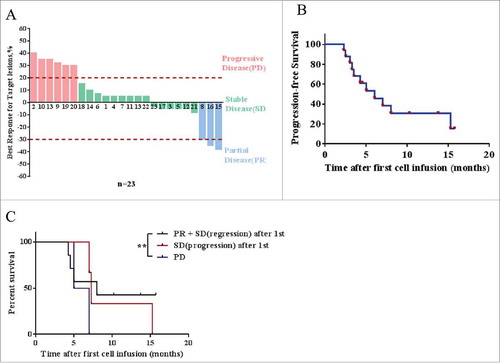
Table 2. Patients’ response and toxicity.
Table 3. CART-133 efficacy in all patients.
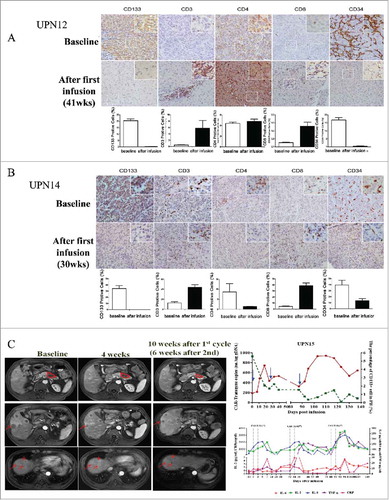
Figure 5. Special presentations. (A) Immunohistochemical examination (diaminobenzidine with hematoxylin counterstaining) of a punch biopsy of liver lesion from patient 12 before and 41 weeks after the first CART-133 cell infusion. (B) Immunohistochemical examination of patient 14 before and 30 weeks after the first CART-133 cell infusion showed that tumor cells were CD133- after cell infusion. Notably, scattered CD3+ and CD8+ cells infiltrated the tumor after infusion, and CD34+ cells significantly decreased. (C) Left: Representative tumor response images for patient 15 before and after CART-133 cell infusion, contrast-enhanced MRI scans show pancreas and liver lesions reduced significantly 4 weeks after the first CART-133 cell infusion and remained reduced after the second cell infusion. Right: CD133+ cells in PB, CAR-gene copy numbers in PB and cytokines in serum were detected before and at serial time points after CART-133 cell infusion in patient 15.
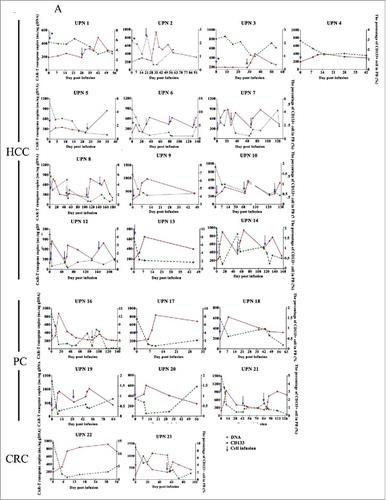
Biological evidence of CART-133 cells. (A) Quantitative real-time PCR was performed on genomic DNA harvested from each patient's PB mononuclear cells collected before and at serial time points after CART-133 cell infusion, using primers specific for the transgene. CD133+ cells count change from baseline in the blood after the infusion of CART-133 cells in 21 patients. CART-133 cell infusion in cohort 1 with * is shown. (B) CAR-gene copy numbers analysis from 22 patients (except patient 11, who refused to offer blood for detection) before and during the 1 month after cell infusion; the number of CART-133 cell infusion cycle was 41. (C) Patients were divided into 4 groups based on time of duration of PFS.