Figures & data
Figure 1. Ipi and Ipi-Bev elicited humoral immune responses to Gal-3. A and B) Immunoblot analysis (A) and ELISA (B) of Gal-3 antibodies in pre- and post-treatment plasma samples of representative melanoma patients treated with Ipi-Bev. C and D) Gal-3 antibody titers in pre- and post-treatment plasma samples of Ipi-Bev treated (C) and Ipi alone treated (D) patients. E) Proportions of Ipi-Bev, Ipi alone and PD-1 blockade treated patients with Gal-3 antibody fold changes ≥ 1.5. Patients receiving PD-1 blockade had the lowest incidence while Ipi and Ipi-Bev treated patients are comparable (Ipi-Bev vs. PD-1 blockade, P = 0.003; Ipi vs. PD-1 blockade, P = 0.008; Ipi-Bev vs. Ipi, P = 0.81).
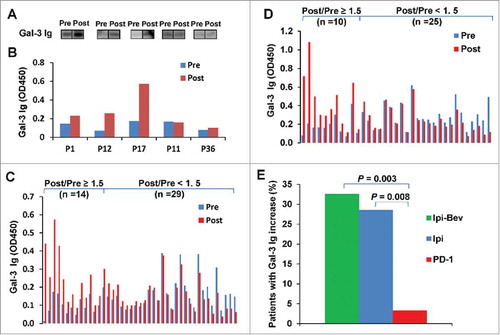
Table 1. Circulating VEGF-A concentrations in Ipi-Bev and Ipi treated patients with therapy-induced antibody responses to Gal-3.
Figure 2. Ipi-Bev-induced humoral immune responses to Gal-3 correlated with better clinical outcomes. A) Patients were plotted based on their Gal-3 antibody fold changes. Each bar represents a patient and the color of the bar indicates clinical response of the patient. CR/PR, complete/partial responses; SD, stable disease; PD, progressive disease. B) Higher percentage of patients with Gal-3 antibody fold changes ≥ 1.5 achieved CR/PR than those with Gal-3 antibody fold changes < 1.5 (P = 0.009). C) Conditional landmark analysis (18 weeks) of patients based on Gal-3 antibody fold change ≥ 1.5 or < 1.5 (P = 0.017). The median survival of the patients with Gal-3 antibody fold change < 1.5 was 73 weeks (95% CI, 55 to 83), while that of patients with fold change ≥ 1.5 was unreached. D) Ipi treated patients were plotted based on their Gal-3 antibody fold changes. E) Ipi-induced Gal-3 antibody responses were not associated with clinical responses. F) Ipi-induced Gal-3 antibody responses were not associated with overall survival. The median survival of the patients with Gal-3 antibody fold change ≥ 1.5 and < 1.5 was 99.2 weeks (95% CI: 12.6 – 186.8) and 58.5 weeks (95% CI: 36.4 – ∞) respectively. However, the difference in survival is not statistically significant (P = 0.832).
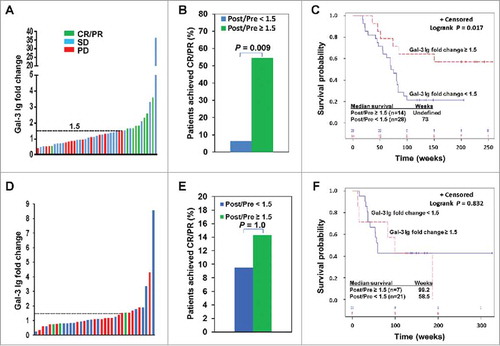
Figure 3. Ipi-Bev influenced Gal-3 expression in melanoma tumors and in the circulation of melanoma patients. A) Patient P4. Gal-3 expression was reduced in TEC while modestly increased in tumor cells after Ipi-Bev treatment. B) Patient P20. Gal-3 expression was downregulated in tumor cells but not in TEC as a result of treatment. C) Circulating Gal-3 levels in pre- and post-treatment plasma samples. Patients were grouped into CR/PR, SD and PD subgroups. In each subgroup, increase, decrease, or no change in Gal-3 levels were seen.
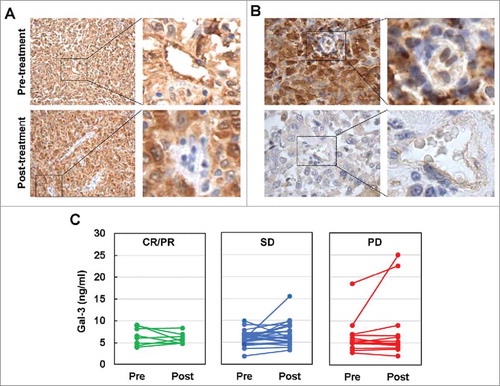
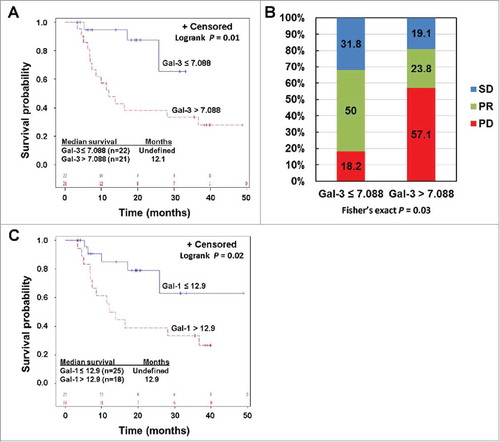
Figure 4. Pre-treatment circulating Gal-3 and Gal-1 is respectively associated with clinical outcomes in PD-1 blockade treated patients. A) Kaplan-Meier survival curves of patients based on pre-treatment Gal-3 levels. Median survival in patients with Gal-3 > 7.088 ng/ml was 12.1 months (95% CI: 7 to 37 months), and was not reached in patients with Gal-3 ≤ 7.088 ng/ml (P = 0.01). B) Responses to PD-1 blockade based on pre-treatment Gal-3 levels. Percentages of patients achieved PR or SD or experienced PD are also indicated. C. High pre-treatment circulating Gal-1 was associated with reduced survival in PD-1 blockade treated patients. Patients were divided into high and low groups based on a division point of circulating Gal-1 of 12.9 ng/ml. Median survival in patients with high Gal-1 was 12.9 (95% CI: 6.9 – 36.7) months, and was not reached in patients with low Gal-1 (P = 0.02).