
Figures & data
Table 1. Patient characteristics at the beginning of anti-PD-1 therapy and type of radiotherapy.
Table 2. Response rates in radiated and non-radiated areas after first round of radiotherapy.
Figure 1. Target lesions changes in radiated and non-radiated areas. The waterfall plots show the maximum change from the baseline in the sum of the reference diameters of the target lesions on radiated (panel A) and non-radiated areas (panel B). Patients were divided in 2 groups: those with rapidly progressing symptomatic lesions or threatening location(s) who received radiotherapy within first 3 months of PD-1 blockade were in the “emergency” group (EG, blue bars); those who had progressive disease either slowly or after first response or stable disease on anti-PD-1 therapy were in the “late radiotherapy group” (LRG, red bars). Black lines in Panels A and B indicate a 20% increase or a 30% reduction in the sum of target lesions (cut-off for PD, PR and SD according to the RECIST 1.1. criteria).
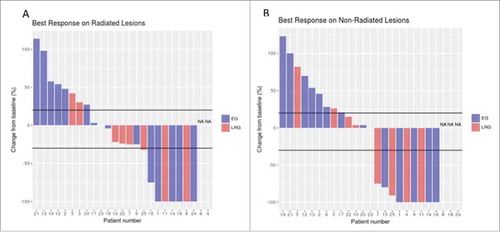
Figure 2. Progression-free survival in the “emergency” (EG) and “late radiotherapy” (LRG) groups. Panel A shows the Kaplan–Meier curves for progression-free survival (PFS) plotted from the first dose of anti-PD-1 mAb. Panel B shows the Kaplan–Meier curves for PFS since the first day of radiotherapy. Curves for the EG and LRG groups are in blue and dotted, and in red and continuous, respectively. NR: not reached.
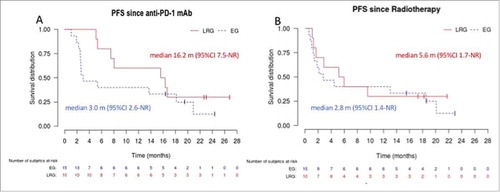
Figure 3. Melanoma-specific survival in the “emergency” (EG) and “late radiotherapy” (LRG) groups. Panel A shows the Kaplan–Meier curves for disease-specific survival plotted from the first dose of anti-PD-1 mAb. Panel B shows the Kaplan–Meier curves for disease-specific survival since the first day of radiotherapy. Curves for the EG and LRG groups are in blue and dotted, and in red and continuous, respectively. NR: not reached.
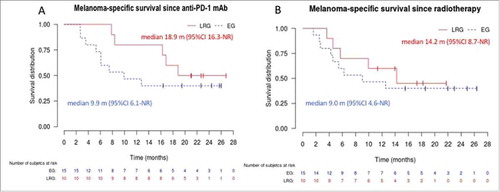
Figure 4. Example of responses in radiated and non-radiated zones in a patient of the “late radiotherapy” group. shows representative images from (18)F-labeled fluorodeoxyglucose-positron emission tomography (FDG-PET) scans from patient #11. She had widespread in transit metastases on the right lower limb that had progressed on BRAF inhibitor monotherapy (vemurafenib). Despite switching treatment to nivolumab monotherapy for 4.5 months, lesions continued to progress on iliac nodes (panel A, arrow), lung and liver (panel B, arrow). Four sessions of 6 Gy were delivered to two adjacent metastatic iliac lymph nodes without withdrawing nivolumab treatment. All radiated (panel C) and non-radiated in-transit, lungs and liver (panel D) metastases had disappeared on PET-CT-scans performed 12 m after radiation. Nivolumab was discontinued, and the patient remained disease-free 6 months later.
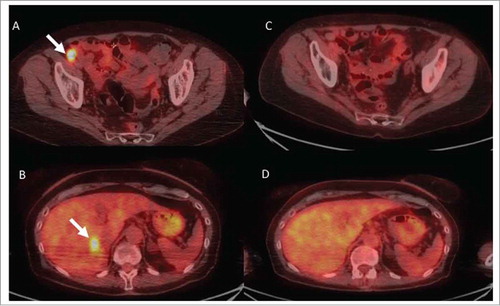
Table 3. Adverse events during treatment with radiotherapy and anti-PD-1 mAb.
Appendix 1. Indications for emergency radiotherapy.
Appendix 2. Radiated and non-radiated areas: responses for each patient.