Figures & data
Figure 1. Distribution of MDSCs in peripheral blood and tumor samples from patients with ESCC. (A) Single cell suspensions were prepared from peripheral blood and tumor tissues from patients with ESCC (n = 75) or healthy donors (n = 15), and analyzed using flow cytometry. (B, C) Inhibition of T cell proliferation and function were assessed using flow cytometry. (D) Clinical samples were divided into two groups according to accumulation of PMN-MDSCs in tumor tissue, and overall survival was analyzed (n = 54). (E) Survival of patients correlated with CD33 expression from TCGA database (n = 93), as a PMN-MDSC marker. *P < 0.05; **P < 0.01.
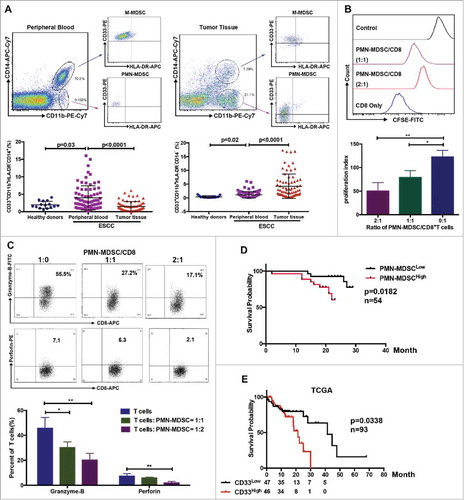
Figure 2. PMN-MDSC accumulation regulated by metformin. (A) Paired analysis of PMN-MDSC frequency in peripheral blood and tumor tissues. (B) Clinical characteristics of eight patients showing higher PMN-MDSC frequency in peripheral blood than in tumor samples. (C) Comparative analysis of PMN-MDSC distribution in patients with ESCC treated with metformin. Results presented as ratio between tumor-infiltrating and circulating MDSCs. Expression of CD33 (D), Arg-1, iNOS, and NOX (E) in tumor tissues from patients treated with metformin was measured using qRT-PCR. (F) CD33 expression in tumor samples was analyzed using immunohistochemistry. (G) Overall survival of patients with ESCC, with or without diabetes, treated or not-treated with metformin shown as a Kaplan-Meier curve. Statistical significance determined by a log-rank test. *P < 0.05; **P < 0.01.
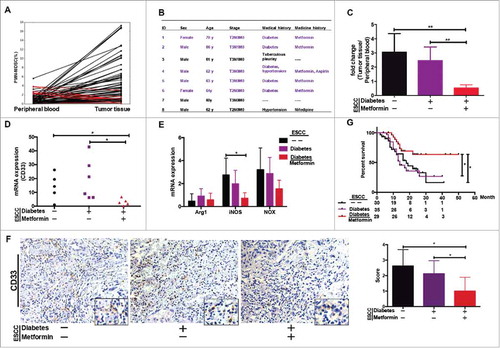
Figure 3. Metformin inhibits PMN-MDSC recruitment via CXCL1. (A) Chemokine profiles was performed in supernatants of esophageal tumors from patients treated or not treated with metformin. Results were normalized to tumor weight. (B) CXCL1 and CXCL5 production in tumor samples detected by ELISA, expressed in pg/ml-mg. (C) Expression of CXCL1 and CD33 in consecutive tumor sections was detected using immunohistochemistry (top). CD33 expression plotted against CXCL1 expression (both detected by immunohistochemistry) or CXCL1 measured using qRT-PCR plotted against frequency of PMN-MDSCs detected by flow cytometry (bottom). Correlation was evaluated using a linear regression analysis. (D) Migration of PMN-MDSCs was assessed using a transwell assay after incubation with human recombinant CXCL1 protein. Data are expressed as number of migrated cells. (E) CXCL1 expression was measured in different ESCC cell lines using qRT-PCR. (F, G) TE-7 tumor cells were incubated with metformin and CXCL1 expression was measured by qRT-PCR, ELISA (F), and immunofluorescence (G). (H) TE-7 cells were cultured in the lower chamber with metformin and CXCL1. Migration of PMN-MDSCs was assessed using a transwell assay. *P < 0.05; **P < 0.01.
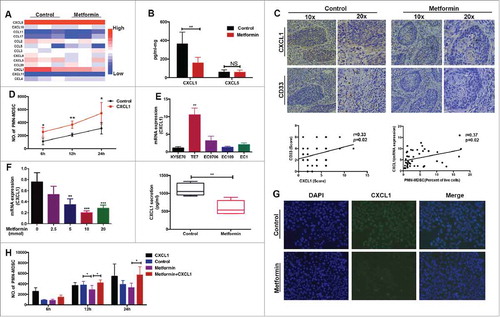
Figure 4. Metformin downregulates CXCL1 expression through AMPK activation. Dose-dependent effect of metformin on AMPK phosphorylation in TE-7 cells was detected by western blotting. (B) TCGA data showing CXCL1 expression together with PRKAA1/2, PRKAB1/2, and PRKAA2. (C-F) After treated with metformin and Compound-C or siRNA-AMPK, CXCL1 expression was measured by qRT-PCR and ELISA. (G) Cells were incubated with metformin, Compound C or siRNA-AMPK, the activity of pAMPK and NF-κB were measured by western blotting. (H) Treatment with Compound-C and si-AMPK reversed the inhibition of PMN-MDSC migration by metformin, shown in a migration assay. And si-AMPK1 or si-AMPK2 alone did not have significantly inhibitory effects on PMN-MDSCs migration compared with si-NC (P = 0.1278 and P = 0.1136 respectively). *P < 0.05; **P < 0.01.
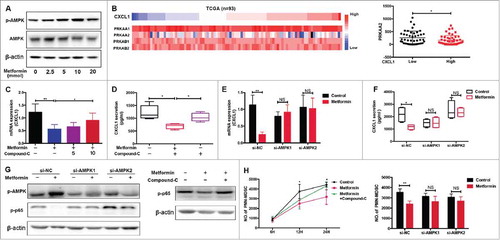
Figure 5. DACH1 is required for inhibition of PMN-MDSC migration by metformin. (A) TCGA analysis showing expression of CXCL1, DACH1 and NF-κB (B) Expression of PRKAA2 plotted against DACH1. Correlation was evaluated using a linear regression analysis. (C-E) Cells were treated with metformin, Compound C, or AMPK si-RNA. Expression of DACH1 was measured by qRT-PCR or western blotting. (F-H) TE-7 cells were transfected with short hairpin RNAs to inhibit DACH1 expression. Efficiency of transfection was determined by qRT-PCR and western blotting (F). CXCL1 secretion was measured by ELISA (G) and NF-κB activation by western blotting (H). *P < 0.05; **P < 0.01.
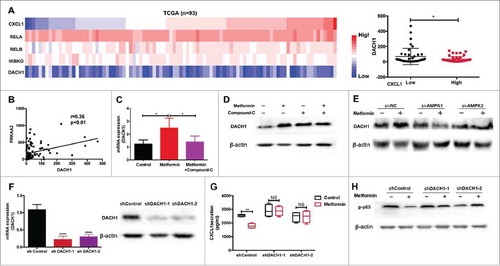
Figure 6. Metformin exerts anti-tumor effects in vivo by inhibiting PMN-MDSC accumulation via the AMPK/DACH1/ CXCL1 axis. (A) Experiment design in vivo. (B) Kinetics of tumor growth in vivo. Tumor volume was measured every second day and expressed in mm3. (C) Accumulation of transferred PMN-MDSCs in tumor-bearing mice treated with metformin was measured using flow cytometry. (D, E) Expression of CD33, iNOS, and NOX2 was measured by qRT-PCR and immunohistochemistry. (F-H) Expression of CXCL1, DACH1 and activation of AMPK or NF-κB in tumor tissues was measured by qRT-PCR, immunohistochemistry and western blotting. *P < 0.05; **P < 0.01.
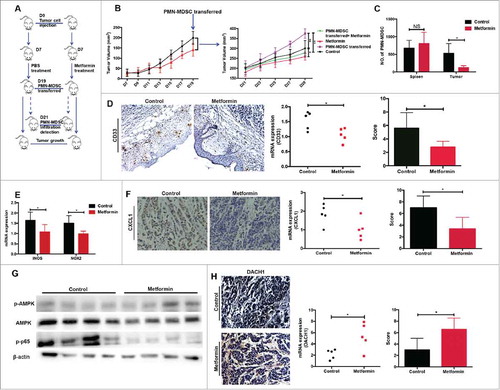
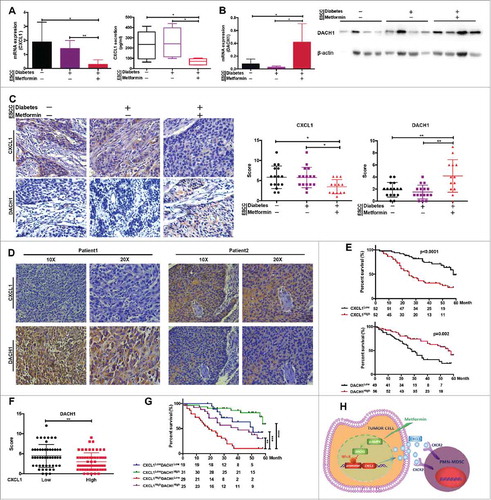
Figure 7. DACH1/CXCL1 regulation of PMN-MDSC accumulation in patients with ESCC undergoing metformin treatment could improve prognosis. CXCL1 expression was verified in tumor tissues and serum from patients with ESCC using qRT-PCR and ELISA. (B) DACH1 expression in patients with ESCC treated with metformin was measured by qRT-PCR and western blotting. (C) Paired analysis of CXCL1 and DACH1 expression in patients receiving metformin treatment. (D) Two representative ESCC samples showing expression patterns of CXCL1 and DACH1. (E) Overall survival of patients with ESCC showing high and low CXCL1 (n = 104; top) and DACH1 expression (n = 105, bottom), presented as a Kaplan-Meier curve. (F)) Expression of DACH1 and CXCL1 was detected using immunohistochemistry. Data show distribution of DACH1 expression in CXCL1-high and CXCL1-low groups. (G) Overall survival of patients with ESCC displaying differential expression of DACH1 and CXCL1, presented as a Kaplan-Meier curve. (H) Schematic representation of the mechanisms of the anti-tumor effects of metformin. *P < 0.05; **P < 0.01; ***P < 0.001; ****P < 0.0001.