Figures & data
Figure 1. Gating strategy for analysis of Slan-DC and monocyte subpopulations. Gating was sequentially done on FVD− (live cells) and CD138− after excluding fragments and doublets. Next, CD45+ HLA-DR+ cells were selected, and Slan-DCs were identified as M-DC8+ (a). Monocyte subtypes were discriminated according to the expression of CD16 and CD14 in HLA-DR+ MDC8- cells. Non-classical monocytes are CD16+ CD14− (b), intermediate monocytes CD16+ CD14+ (c) and classical monocytes CD16− CD14+ (d).
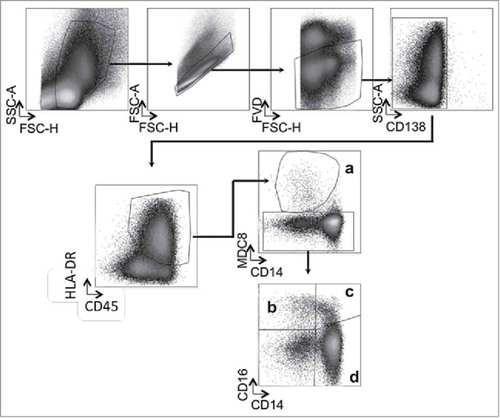
Figure 2. Circulating Slan-DCs are decreased in MM patients while intermediate monocytes accumulate in the bone marrow. The percentage in CD45+ cells and the absolute numbers of Slan-DCs and monocyte populations were compared in the blood and bone marrow from healthy donors, MGUS, MM patients at diagnosis and responding patients. a,b,c,d Number or percentage of indicated cell population from the blood of 11 healthy donors, 10 MGUS, 22 MM and 9 responding patients. e,f,g,h, Number or percentage of indicated cell population from the bone marrow of 6 healthy donors, 15 MGUS, 28 MM and 18 responding patients. i,j,k,l Correlation between the absolute numbers of BM plasma cells and intermediate CD14+ CD16+ monocytes and Slan-DCs in MGUS and MM patients. The Mann-Whitney test was used for comparisons of groups and Spearman's rank test for correlations. p values < 0.05 are represented by *, p values < 0.01 by ** and p values < 0.001 by ***.
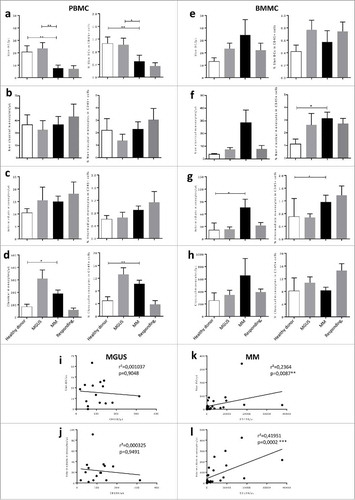
Figure 3. Secretion of IL-12 but not TNF-α or IL-6 is inhibited in Slan-DCs from MM patients. BM or blood Slan-DCs were cultured in the absence or presence of the TLR7/8 ligand R848 for 24 h and compared in terms of cytokine secretion by flow cytometry. For IL-12p40 secretion, a 6 h pre-incubation was performed. a. A representative experiment is shown. b,d,e. Slan-DCs isolated from BM were stimulated or not with R848 and the production of IL12p40 (b), TNF-α (d) and IL-6 (e) were analyzed by intracellular staining and flow cytometry. c. Slan-DCs isolated from PB were stimulated or not with R848 and the secretion of IL-12p40 was analyzed by intracellular staining and flow cytometry. P values < 0.05 are represented by *. p values < 0.01 by **, p values < 0.001 by *** and p values < 0.0001 by ****.
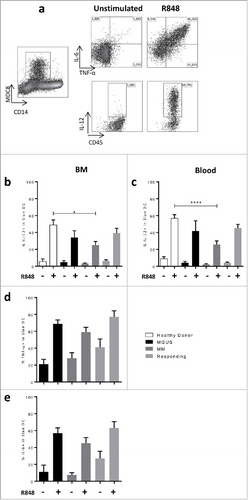
Figure 4. MM cells inhibit IL-12 production by Slan-DCs. a, c, e. Sorted Slan-DCs were cultured for 48 h in the absence or presence of R848 and the indicated MM cell lines for 24 h and then compared in terms of cytokine secretion in the culture supernatant by ELISA. For IL-12p70 secretion, a 6 h pre-incubation was performed. b,d, f. Total PBMC were cultured for 18 h in the absence or presence of R848, Golgi Plug and the indicated MM cell line. Then the cytokine secretion of Slan-DCs was analyzed by flow cytometry after intracellular staining. For IL-12p40 detection, a 6 h pre-incubation was performed. g. Sorted Slan-DCs were cultured for 48 h in the absence or presence of R848 or R848 and IFN-γ and the indicated MM cell line, and then analyzed for IL-12p70 secretion in the culture supernatant by ELISA or by flow cytometry after intracellular staining. h. Sorted Slan-DCs were cultured for 48 h in the presence of R848 and sorted CD138+ cells from 4 different MM patients at diagnosis for 24 h and then analysed for IL-12 secretion in the culture supernatant by ELISA. p values < 0.05 are represented by *, p values < 0.01 by ** and p values < 0.001 by ***.
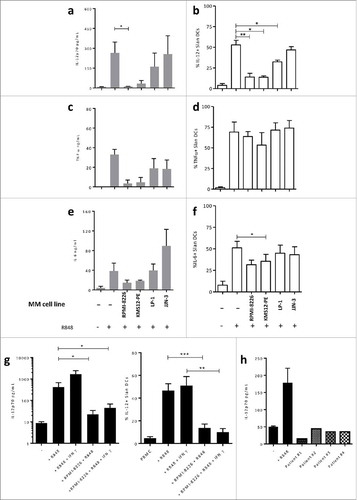
Figure 5. a. Total PBMC were cultured for 48 h in the absence or presence of R848, Golgi Plug and the indicated MM cell line separated or not by a 0.4 µm transwell (TW). IL-12p40 production of Slan-DCs was analyzed by flow cytometry after intracellular staining. b. CD47 expression on myeloma cell lines. c. Total PBMC were cultured for 12 h in the absence or presence of human erythrocytes, then subjected to Ficoll gradient centrifugation to deplete erythrocytes followed by stimulation with R848 and Golgi Plug. The IL-12p40 production of Slan-DCs was analyzed by flow cytometry after intracellular staining after 24 hours. P values < 0.05 are represented by *. p values < 0.01 by ** and p values < 0.001 by ***.
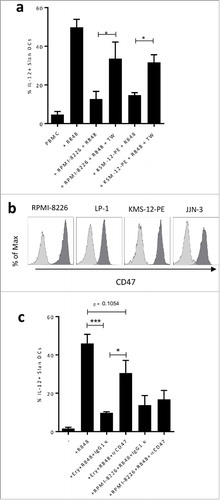
Figure 6. MM cell line impacts Slan-DCs phenotype. Slan-DCs were sorted from total PBMC and then maintained in the presence or absence of a MM cell line for 48 h before phenotyping. a. Dot plot representing the expression of CD14 and CD16 on total PBMC, freshly-sorted Slan-DCs or Slan-DCs after culture in the presence or absence of RPMI-8226. b. Graphs show the level of expression of indicated antigens in freshly-sorted Slan-DCs or Slan-DCs after culture with or without RPMI-8226. (n = 4). c. Slan-DCs were cultured in the presence or absence of RPMI-8226 for 48 h and then FACS sorted before RT-qPCR analysis of CD14 and CD38 expression (n = 3).*p<0.05, **p<0.01.
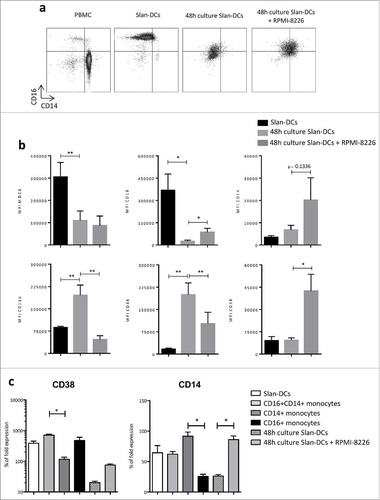
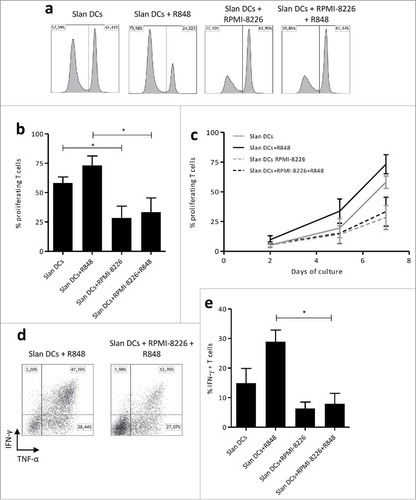
Figure 7. MM cell line impacts Slan-DCs-mediated T-cell proliferation and Th1 programming. a-c. Slan-DCs were cultured in the presence or absence of RPMI-8226 and/or R848 for 48 h, washed and subsequently co-incubated with allogeneic Cell Fluorescence Proliferation Dye 450-labelled CD3+ T cells. At days 2, 5 and 7, T cells were harvested and analyzed by flow cytometry. Values represent the percentage of proliferating cells stained with Cell Fluorescence Proliferation Dye 450. a. Histograms representing the fluorescence intensity of proliferating T cells at day 7 of culture. b, Percentage of proliferating T cells at day 7c, Percentage of proliferating T cells at days 2, 5 and 7 of culture. d-e Slan-DCs were cultured in the presence or absence of RPMI-8226 and/or R848 for 48 h, washed and subsequently co-incubated with naïve CD45RA+ CD4+ T lymphocytes. After 7 days, the percentage of IFN-γ producing CD4+ T cells was determined by flow cytometry. d. A representative experiment is shown. *p<0.05, by Student t test.