Figures & data
Figure 1. Chimeric MHC class I constructs induce DC maturation and CTL responses in vitro. Bone marrow-derived DC were electroporated with hβ2 m constructs: TRP-1-Kb and TRP-1-TRL4 (A) or with TYR-Kb and TYR-TLR4 (B) encoding mRNA respectively. Expression kinetics of chimeric-hβ2m constructs on DC was assessed by flow cytometry. Empty electroporated DC (EP only) served as a control. (C) Secretion of IL-12 and IL-10 by immature, LPS-maturated, and mRNA-electroporated DC (TRP-1+TYR EP-DC) was measured by ELISA and expressed as pg/mL (n = 3). (D-F) Expression of DC maturation markers (CD80, CD86, MHC-class II) was measured by flow cytometry 6 h after electroporation. Representative histograms are shown. G and H, CTL were induced by immunization of C57 BL/6 mice with DC electroporated with respective TRP1-Kb/TRL4 or TYR-Kb/TLR4 encoding mRNA (n = 3) and assessed by CTL in vitro killing assay. Results are presented as the percentage of killed syngeneic B16F10.9 and B16MO5 melanoma target cells following co-incubation with CTL induced by TYR-Kb/TLR4 (G) and TRP-1-Kb/TLR4 constructs (H). D122 Lewis lung carcinoma mouse cells that do not express TRP1 and TYR were used as a negative control. Data are representative of two independent experiments.
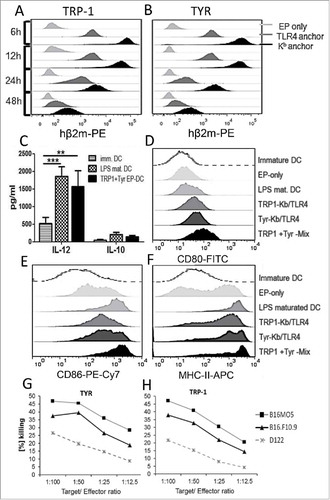
Figure 2. Comparative analysis of in vivo CTL responses induced by mRNA-electroporated and peptide-loaded DC. C57 BL/6 mice were vaccinated intraperitoneally (i.p.) three times with DC electroporated (EP) with TRP1-β2 m-Kb/TLR4, TYR-β2 m-Kb/TLR4, or their combination (Mix-EP) as well as with peptide-loaded (PL) DC with TRP-1455–463, TYR360–368 or their combination (Mix-PL) (n = 3). Mice vaccinated with SIINFEKL-loaded DC were used as a control group. (A) CTL in vivo killing assay was performed ten days after the last vaccination. Representative flow cytometry histograms showing CFSE-labeled, peptide-loaded target cells, which were injected intravenously into immunized mice. (B) CTL activity is presented as the percentage of specific killing of peptide-loaded target cells. (C) Intracellular IFN-γ production in CD8 T cells was measured by flow cytometry following in vitro restimulation of splenocytes with relevant peptides. SIINFEKL peptide served as a control. Results are shown as the percentage of IFN-γ producing CD8 T cells among total CD8 T cells. (D) Frequency of CD8+CD62 L−CD44+ effector memory (EM) T cells in spleens is shown as the percentage within total CD8 T cells. Data are representative of two independent experiments. *P < 0.05, **P < 0.01.
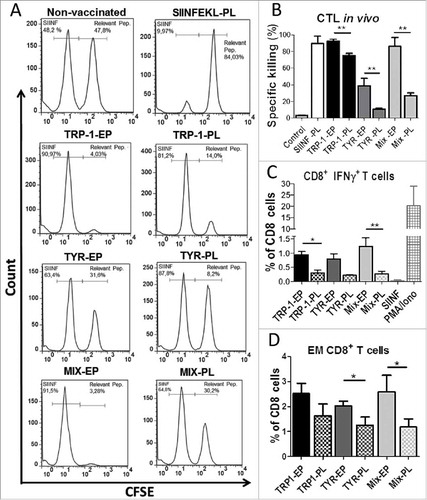
Figure 3. Vaccination with mRNA-electroporated DC induces anti-tumor responses in melanoma-bearing RET transgenic mice. Mice with palpable tumors were vaccinated i.p using mRNA-electroporated or peptide loaded DC. DC electroporation was performed by mRNA encoding TRP-1-hβ2 m-Kb/TLR4 (TRP-1-EP), TYR- hβ2 m-Kb/TLR4 (TYR-EP), or their combination (Mix-EP). LPS-maturated DCs were loaded with short peptide mix (TRP-1455–463, TYR360–368, combination; Mix-PL). Another group was vaccinated subcutaneously with a combination of long peptide mix (LP, TRP-1448–472 + TYR353–377), anti-CD40 mAb and poly:IC. Mice vaccinated with empty DC were used as a control (Con). (A, B) Survival of mice is shown as a Kaplan-Meier curve (n = 6–12/group). (C-H) Ten days after last vaccination with mRNA-electroporated DC, tumor infiltrating CD8 T cells were analyzed by flow cytometry (n = 8). Results are presented as the percentage of IFN-γ producing CD8 T cells among total CD8 T cells (C), mean fluorescence intensity (MFI) of the TCR ζ-chain in CD8 T cells (D), the percentage of CD69 (E), PD-1 (F), Ki-67 (G), and CD62 L−CD44+ EM (H) CD8 T cells among total CD8 T cells. Data are representative of two independent experiments. *P < 0.05, **P < 0.01.
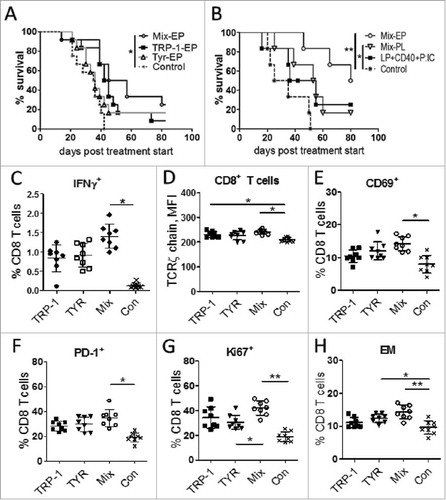
Figure 4. Vaccination with mRNA-electroporated DC impedes immunosuppressive pattern of MDSC and Treg in melanoma-bearing RET transgenic mice. Mice with palpable tumors were vaccinated i.p. using DC electroporated with TRP1- hβ2 m Kb/TLR4 (TRP-1), TYR- hβ2 m Kb/TLR4 (TYR) encoding mRNA, or the combination (Mix). Mice vaccinated with empty DC were used as a control (Con). Tumor-infiltrating MDSC and Treg were analyzed by flow cytometry ten days after last vaccination (n = 8). Arginase (Arg)-1 expression (A) and nitric oxide (NO) production (B) by CD11b+Gr1+ MDSC is presented as MFI. C, PD-L1 expression is shown as the percentage of positive cells among total MDSC. (D) CD4+CD25+Foxp3+ Treg are presented as the percentage within total CD4 T cells. Ki67 (E) and CD39 (F) expression on Treg is shown as the percentage of respective subset within total Treg. Data are representative of two independent experiments. *P < 0.05, **P < 0.01.
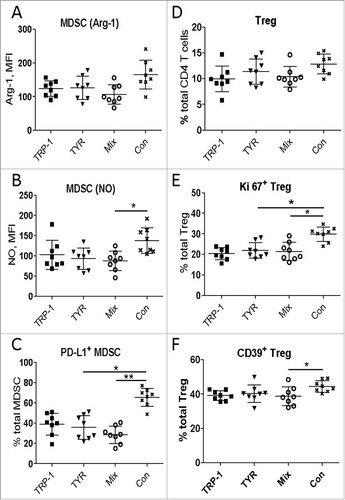
Figure 5. Combination of DC vaccination with ultra-low dose paclitaxel stimulates anti-tumor responses in melanoma-bearing mice. Mice from RET-tg (RET) or BRAF melanoma models with palpable tumors were vaccinated i.p. three times using DC electroporated with combination of hgp100 + TRP-2 + TRP-1 + TYR-hβ2 m-Kb/TLR4 (Q-Mix) mRNA. Some vaccinated mice additionally received i.p. ultra-low dose Pac (1 mg/kg) three times in weekly intervals. Other mice were treated with Pac only or with empty DC (Con). Survival of RET (A) or BRAF (B) mice is shown as a Kaplan-Meier curve (n = 9–12/group). Tumor-infiltrating T cells from RET (C-E, n = 8) or BRAF (F-H, n = 6) mice were analyzed by flow cytometry 10 days after last vaccination. Results are presented as the percentage of IFN-γ producing CD8+ T cells among total CD8 (C, F), MFI of the TCR ζ-chain in CD8 T cells (D, G) and the percentage of CD62 L−CD44+ EM (B, H) CD8 T cells among total CD8 T cells. Data are representative of two independent experiments. *P < 0.05, **P < 0.01, ***P < 0.001.
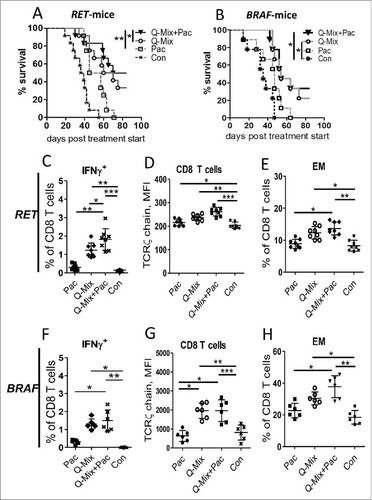
Figure 6. Combined immunotherapy with vaccine and ultra-low dose paclitaxel downregulates MDSC and Treg activity markers. Tumor-infiltrating MDSC and Treg from RET (A-D, n = 8) and BRAF mice (E-H, n = 8) were analyzed by flow cytometry 10 days upon last vaccination. Arg-1 expression (A, E) by MDSC is presented as MFI. (B, F) PD-L1 expression is shown as the percentage of positive cells within total MDSC. (C, G) CD4+CD25+Foxp3+ Treg are presented as the percentage within total CD4 T cells. (D, H) Ki67 expression on Treg is shown as the percentage of respective subset among total Treg. Data are representative of two independent experiments. *P < 0.05, **P < 0.01, ***P < 0.001.
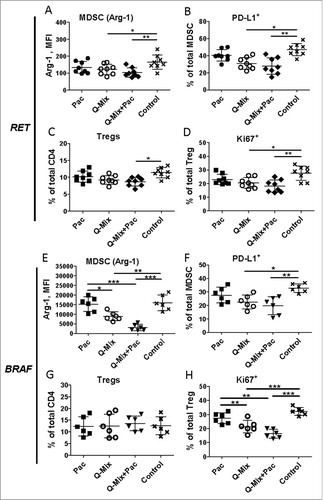
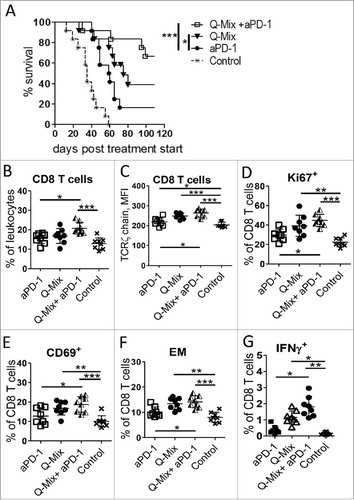
Figure 7. Enhanced anti-tumor effect of DC vaccine and anti-PD-1 antibodies in melanoma-bearing mice. RET-tg mice with established tumors were vaccinated i.p. three times in weekly intervals using DC electroporated with combination of mRNA encoding for hgp100 + TRP-2 + TRP-1 + TYR- hβ2 m-Kb/TLR4 (Q-Mix). Some vaccinated mice additionally received 4 times i.p. injections of 250 µg anti-PD-1 antibody (aPD-1) or isotype control (Control) every 3 days. (A) Survival of mice is shown as a Kaplan-Meier curve (n = 6–12/group). Ten days after last vaccination, tumor infiltrating CD8 T cells were analyzed by flow cytometry (n = 8). Results are presented as the percentage of tumor-infiltrating CD8 T cells among total leukocytes (B), MFI of the TCR ζ-chain in CD8 T cells (C), the percentage of Ki67+ (D), CD69+ (E), CD62 L−CD44+ EM (F) and IFN-γ producing CD8 T cells (G) among total CD8 T cells. Data are representative of two independent experiments. *P < 0.05, **P < 0.01, ***P < 0.001.