Figures & data
Figure 1. MG1-Maraba lethally infects prostatic cancer. Relative viability of multiple PCa cell lines was assessed using alamar blue 48 hours after infection of PCa cells in monolayer over a range MOIs (mean and SEM displayed, assays performed in triplicate) (A). Representative image of PCa core biopsies being obtained following prostatectomy for the treatment of a patient diagnosed with advanced PCa (B). Plaque assays following ex vivo infection from 10 patient's PCa core biopsies with MG1-GFP (mean and SEM displayed, assays performed in duplicate) (C). Representative bright field, fluorescent and overlaid images following infection of a core biopsy with MG1-GFP (4x magnification) (D). Immunohistochemical quantification of % cell positivity for MG1-Maraba following ex vivo infection of PCa biopsy cores with MG1-GFP (mean and SEM displayed, all sections stained at least in duplicate except patient #7 where biopsy material was limited) (E). Representative image of immunohistochemical staining for MG1-Maraba using DAB substrate chromogen and hematoxylin counterstain (F) (scale bar = 900 μm).
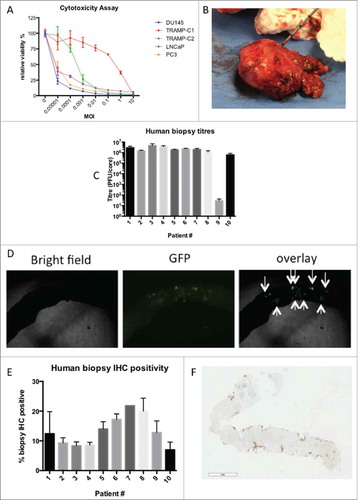
Figure 2. MG1-Maraba is oncolytic against TRAMP-C2 tumors. Treatment of male mice with established TRAMP-C2 tumors with 3 intravenous doses of 5 × 10⁸ PFU MG1-GFP (n = 5) results in transient decreases in tumor volumes (A) (arrows denote timings of MG1 treatments, mean tumor volumes and SEM displayed) whereas intra-tumoral (n = 5) dosing (5 × 10⁸ PFU MG1-GFP) exerts a significant anti-neoplastic effect (B) (mean fold change of tumor volume and SEM displayed, comparison performed using ANOVA, *p≤0.05) compared to untreated control mice (n = 5). TRAMP-C2 tumors were harvested from mice (n = 4), processed into uniform cores (biologic replicates n = 8), maintained in tissue culture and infected with MG1-GFP ex vivo, infection was demonstrated by fluorescence as depicted by black signal (C) and fluorescence was quantified (mean and SEM displayed, comparison performed using ANOVA, *p ≤ 0.05, **p ≤ 0.01, ***p ≤ 0.001) (D). Monolayers of TRAMP-C2 and the type I IFN responsive control L929 cells were pre-treated with murine IFN-β (excluding 0 IFN control columns) prior to infection with a WT VSV expressing GFP and infection was demonstrated by black signal indicative of fluorescence (E) and fluorescence was quantified (mean and SEM displayed, comparison performed using multiple t tests with Holm-Sidak correction, *p ≤ 0.05, **p ≤ 0.01, ***p ≤ 0.001) (F).
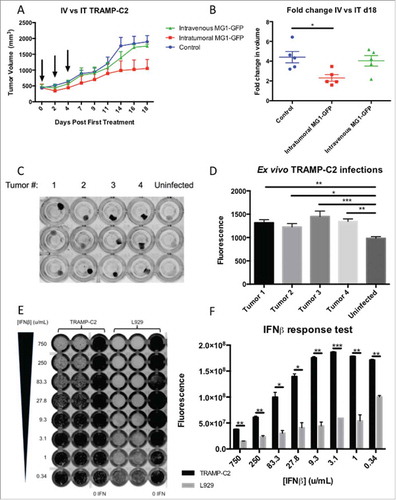
Figure 3. Oncolytic vaccination breaches immune tolerance. Tumor-free female C57BL/6 mice were treated with oncolytic vaccination against STEAP (n = 3) to assess the induction of specific immune responses against known STEAP peptide epitopes as indicated by IFNγ production from CD8+ T cells collected after the prime (A) and boost (B) (mean and SEM displayed). Tumor-free male mice were treated with oncolytic vaccination against STEAP (n = 5) as well as a control group of mice treated with Ad-BHG: MG1-GFP (n = 5). ICS was performed after prime (C) and boost (D) (mean and SEM displayed). Prostatic inflammation was observed following STEAP vaccination (E) (hematoxylin and eosin)- note the heavy pleocelluar luminal infiltrate compared to healthy prostatic tissue (F) (hematoxylin and eosin). Luminal epithelial STEAP expression was confirmed immunohistochemically in the healthy prostate (G) (DAB substrate chromogen and hematoxylin counterstain) (scale bars = 100 μm).
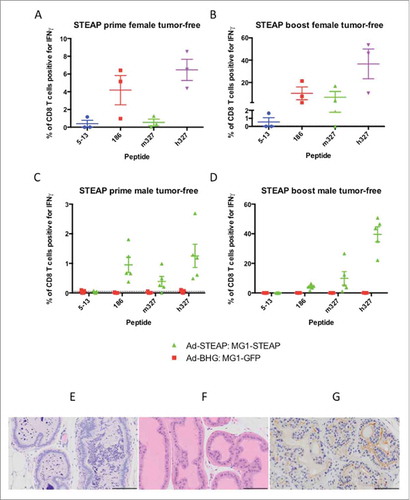
Figure 4. STEAP vaccination prolongs survival in a prostate cancer model. Immunofluorescence of TRAMP-C2 cells was performed using a polyclonal STEAP antibody followed by a fluorescent-conjugated secondary antibody and nuclei were stained with DAPI. Images were captured on the DAPI and Texas Red channels and a composite overlay image was made (A) (white bar represents 100μm). Male mice with established TRAMP-C2 tumors were treated with Ad-BHG: MG1-GFP (n = 8), Ad-STEAP: MG1-STEAP (n = 16) and compared to a control group of untreated mice (n = 18) (data combined from 2 experiments). Tumor volumes are plotted for each group from a single experiment (B) (arrows denote timings of MG1 treatments, mean and SEM displayed) and tumor volume fold change was calculated for all mice (mean fold change of tumor volume and SEM displayed, comparison performed using ANOVA, **p ≤ 0.01, ***p ≤ 0.001) and collective median survival times were calculated from the initiation of treatment (C) (log rank test used to compare survival times, ****p ≤ 0.0001). ICS on peripheral blood cells following re-stimulation with pooled murine STEAP peptides was performed at the time of peak-boost responses (E) (mean and SEM displayed, comparison performed using ANOVA, ****p ≤ 0.0001).
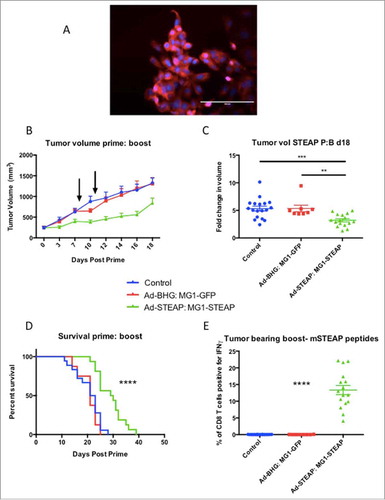
Table 1. Alterations to the immune transcriptome after STEAP vaccination. List of all significant differentially expressed genes (adjusted p≤0.05) between peak-boost (n = 4) and untreated (n = 4) TRAMP-C2 tumors and a separate analysis between peak-boost and end-stage (n = 4) STEAP vaccinated tumors using a murine immunology NanoString panel. Increased and decreased expressions depicted by red and green respectively and mean fold change is displayed numerically.
Figure 5. Oncolytic vaccination induces an active T cell gene signature. Sample distribution (principal component analysis (PCA) plot). Visualization of the first 3 components of PCA. The analysis was performed based on all 561 genes profiled on the NanoString platform (A). Genes differentially expressed within TRAMP-C2 tumors. mRNA was isolated from TRAMP-C2 tumors of 4 mice receiving STEAP vaccination at peak-boost (6 days after the first dose of MG1-STEAP) and compared to 4 mice with untreated tumors at the same point. Peak-boost tumors were also compared to 4 end-stage tumors that were previously treated with STEAP vaccination. NanoString analysis using a murine immunology panel was undertaken and genes with significantly altered expressions between groups (adjusted p≤0.05) are displayed using a heat map with increased and decreased expressions depicted by red and blue respectively. Unsupervised clustering was performed based on genes that were significantly differentially expressed in both comparisons (B).
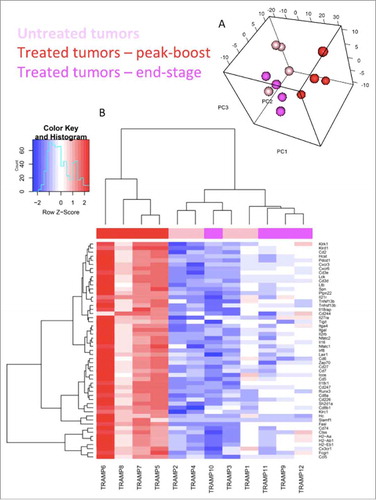
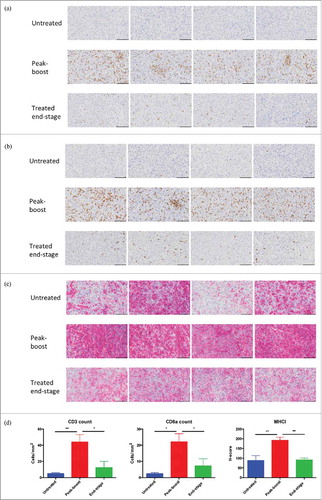
Figure 6. Oncolytic vaccination converts the tumor microenvironment. Immunohistochemical staining for CD3 (A), CD8a (B) and MHCI (C) of untreated tumors (n = 4), peak-boost (n = 4) (6 days after first dose of MG1-STEAP) and end-stage (STEAP vaccinated) tumors (n = 4). Tumors stained immunohistochemically for the CD3 and CD8a cell surface antigens using DAB substrate chromogen and for MHCI using AEC substrate chromogen, nuclei were counterstained with hematoxylin (scale bars = 100μm). Immunohistochemical quantification of CD3, CD8a and MHCI staining from untreated (n = 4), peak-boost (n = 4) and end-stage (n = 4) TRAMP-C2 tumors (D) (mean and SEM displayed, comparison performed using ANOVA, *p ≤ 0.05, **p ≤ 0.01,).