Figures & data
Figure 1. Preparation and characterization of biotinylated Dox-liposomes (bDoxL) and Dox-microbubble complexes (MbDox). A. Schematic diagram of a liposome-microbubble complex constructed for controlled release of Dox by ultrasound. bDoxL is attached to the surface of biotinylated gas-filled MB through biotin-avidin linkage. B-D. Fluorescent micrograph of MbDox using the fluorescence of the bound Dox (B) was merged with its corresponding transmission image (C) for the resultant image (D). E. Size distribution of bDoxL. F. Size distribution of MbDox and non-loaded Mb. Dox, doxorubicin.
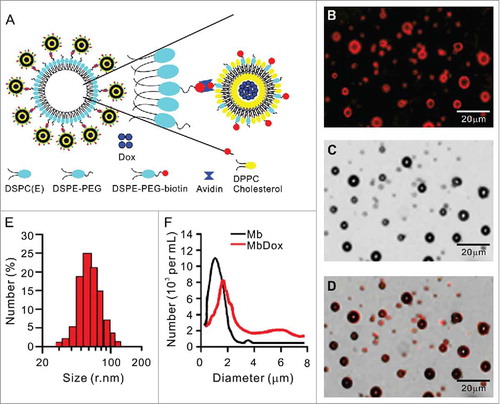
Figure 2. Increased ER stress response and CRT translocation by MbDox+US treatment. LL/2 and CT26 cells were treated with indicated formulations, and tests were performed at 4 h after treatment. A and B. Apoptotic cells after treatment were stained by PI/Annexin-V followed by flow cytometry detection. C and D. Cells after treatment were stained with an antibody against CRT followed by PE-conjugated secondary antibodies (Red) and DAPI (blue) counterstain to detect CRT translocation to cell surfaces. Images were observed by a confocal microscope (C, scale bar = 5 μm), and CRT-positive cells were quantified from three independent experiments (D). E and F. Cells after treatment were stained as in C and D to detect CRT-positive cells by flow cytometry. G and H. Cells after treatment were stained with FITC-conjugated antibody against ERp57 to detect ERp57-positive cells by flow cytometry. Data are expressed as mean ± SEM, * indicates P < 0.05, ** indicates P < 0.001, NS, no significance.
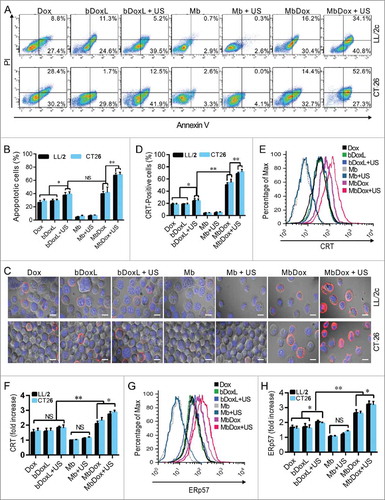
Figure 3. Increased HMGB1 release and ATP secretion by MbDox+US treatment in vitro. LL/2 and CT26 cells were treated with indicated formulations, and tests were performed at 4 h after treatment. A. eIF2-α and its phosphorylated counterpart (indicator of ER stress response) were analyzed by Western blot. B. The densitometry of p-eIF2-α normalized to total eIF2-α from three independent Western blot analyses was quantified by ImageJ software. C. HMGB1 released from treated cells to the supernatant (S-HMGB1) and in whole cell lysates (C-HMGB1) was detected by Western blot. D. The densitometry of S-HMGB1 from three independent Western blot analyses was quantified by ImageJ software. E and F. ATP secretion from LL/2 (E) and CT26 (F) cells, respectively, was quantified by a chemiluminescent ATP Determination Kit. Data are expressed as mean ± SEM, * indicates P < 0.05, ** indicates P < 0.001, NS, no significance.
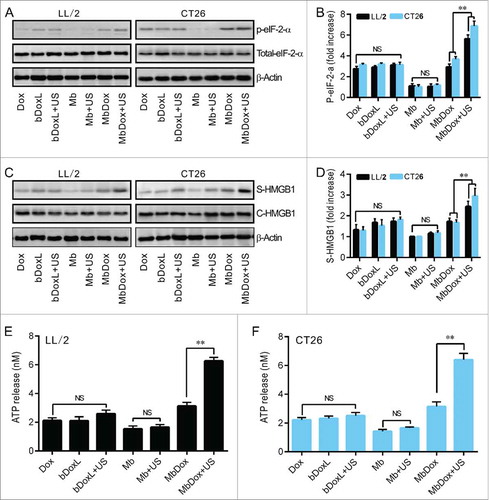
Figure 4. Increased maturation and activation of mDCs by MbDox+US treatment. mDCs were stimulated with conditioned culture media from the indicated formulations for 24 h. A and B. The proportion of CD80+ and CD86+ double-positive cells was determined by flow cytometry. C and D. Cells secreting IFN-γ were detected by flow cytometry. Data are expressed as mean ± SEM, * indicates P < 0.05, ** indicates P < 0.001, NS, no significance.
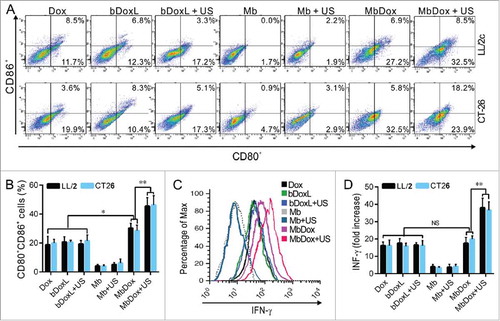
Figure 5. Increased intracellular uptake and tissue accumulation of Dox by MbDox+US treatment. A. LL/2 and CT26 cells were treated with indicated formulations at 4 h after treatment. Images of intracellular Dox distribution were collected by confocal microscopy. Dox is indicated by red fluorescence and the nucleus is stained with DAPI (blue, scale bar = 10 μm). B. The intracellular concentration of Dox in LL/2 and CT26 cells after treatment with the indicated formulations was quantified by a microplate reader. C. Tumor-bearing mice were treated with indicated formulations, and tumor tissues and major organs were collected to analyze the Dox concentration by HPLC. Data are expressed as mean ± SEM, * indicates P < 0.05, ** indicates P < 0.001, NS, no significance.
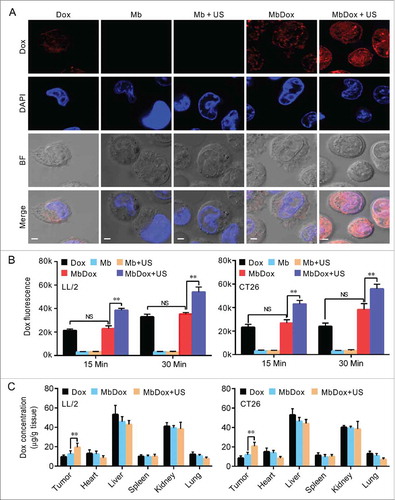
Figure 6. Stronger antitumor immune responses by MbDox+US treatment in vivo. A. Schematic illustration of in vivo experiments to evaluate the tumor vaccine potential of different formulations. B and C. Images of tumor masses (B) and tumor volumes (C) from right lower flanks (5 in each group) at day 21 were collected by a handheld imaging device (TM900). D and E. Cytotoxic T-lymphocyte (CTLs) responses against LL/2 (D) and CT26 (E) tumor cells (target cells) were performed using splenic monocytes from mice treated with indicated formulations. F. Production of antibodies against CT26 tumor lysates in sera from mice injected with indicated formulations was detected by Western blot. G. Splenic monocytes from mice treated with indicated formulations were isolated, and the B cells that secreted antibodies against LL/2 or CT26 lysates (APBCs) among these splenic monocytes were detected by ELISPOT assay. Representative images are shown. H. The average number of APBCs in 1 × 10⁵ spleenic monocytes in triplicate experiments was recorded from LL/2 and CT26 tumor models. Data are expressed as mean ± SEM, * indicates P < 0.05, ** indicates P < 0.001.
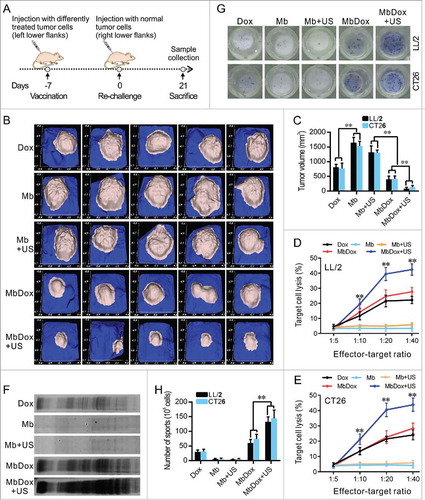
Figure 7. Increased reversion of the immunosuppressive microenvironment by MbDox+US treatment. A. Splenic monocytes from mice injected with indicated formulations were stained with anti-CD8 antibody and an anti-IFN-γ (intracellular) antibody, and then analyzed with flow cytometry. Representative images are shown. B. Percentages of IFN-γ-expressing CD8+ T cells analyzed by flow cytometry in LL/2 and CT26 tumor models. C. Tumor-infiltrating lymphocytes (TILs) from tumor tissues of both LL/2 and CT26 were analyzed by flow cytometry. Representative images the IFN-γ-producing CD8+T cells are shown. D. Percentage of the IFN-γ-producing CD8+ T cells in TILs from mice of LL/2 and CT26 models. E. CD4+ T cells in TILs were gated out and detected as CD25+ and FOXP3+ double-positive Treg cells by flow cytometry. Representative images of the CD4+CD25+FOXP3+ Treg cells are shown. F. Percentage of CD4+CD25+FOXP3+ Treg cells in TILs from mice of LL/2 and CT26 models. Data are expressed as mean ± SEM, * indicates P < 0.05, ** indicates P < 0.001.
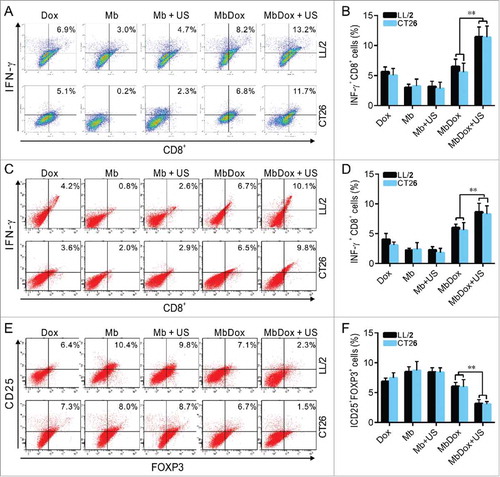
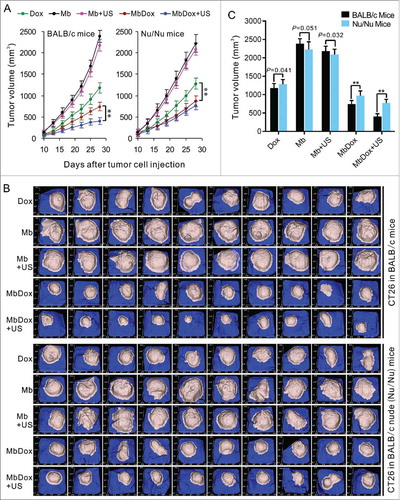
Figure 8. Induction of stronger anti-tumor effects in immunocompetent mice by MbDox+US treatment. Murine LL/2 and CT26 tumor cells were injected into the right flanks of syngeneic C57BL/6 and BALB/c (10 mice/group) or Nu/Nu mice (10 mice/group). When tumor volumes reached 50 mm3, mice were treated with indicated formulations every 3 days for 6 total treatments. A. Tumor volumes at different time points in immunocompetent and in immunodeficient (Nu/Nu) mice, respectively. B. Tumor images of CT26 model at end points from immunocompetent and immunodeficient (Nu/Nu) mice, respectively. Data are expressed as mean ± SEM, * indicates P < 0.05, ** indicates P < 0.001.