
Figures & data
Table 1. Patient characteristics.
Figure 1. Comparison of immune infiltrates and inhibitory molecule expression among MMR-proficient liver metastases (LM), peritoneal metastases (PM) and primary CRC. (A) The frequencies of CD8+ CTL, CD4+Foxp3− Th and CD4+Foxp3+ Treg within CD3+ TIL from LM-CRC, primary CRC and PM-CRC. (B) The frequencies of inhibitory receptor positive cells within CD8+ CTL, Th and Treg in LM-CRC, primary CRC and PM-CRC. (C) The frequencies of B cells, mDC and monocytes (Mono) within CD45+ cells from LM-CRC, primary CRC and PM-CRC. (D) The frequencies of inhibitory ligand positive cells within tumor-infiltrating B cells, mDC and monocytes from LM-CRC, primary CRC and PM-CRC. Values of individual patients are shown, and lines depict medians. Differences were analyzed by unpaired t test or Mann-Whitney test; *p < 0.05, **p < 0.01, ***p < 0.001.
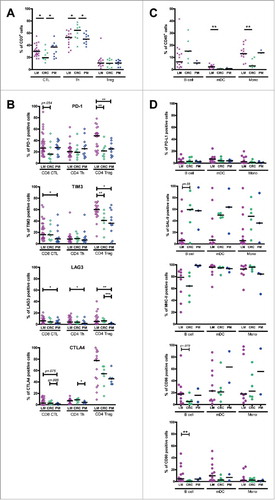
Figure 2. Expression of inhibitory receptors on CD8+ CTL, CD4+ Th and CD4+ Treg in the tumor, TFL and blood of MMR-proficient LM-CRC. PBMC and leukocytes isolated from LM-CRC tumors and TFL were stained with antibodies against PD-1, LAG3, TIM3 and CTLA4. (A) (B) Representative dot plots of inhibitory receptor expression on (A) CD3+CD8+ CTL and (B) CD3+CD4+Foxp3− Th in the tumor, TFL and blood; the gates were made according to appropriate isotype controls. (C) (D) (E) The frequencies of inhibitory receptor positive cells within (C) CD8+ CTL, (D) CD4+Foxp3− Th and (E) CD4+Foxp3+ Treg in the tumor, TFL and blood. Values of individual patients are shown, and lines depict medians. Differences were analyzed by paired t test or Wilcoxon matched pairs test; *p < 0.05, **p < 0.01, ***p < 0.001.
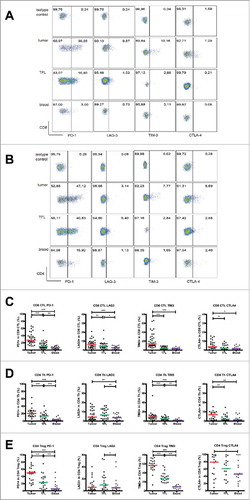
Figure 3. Intra-tumoral antigen-presenting cells of MMR-proficient LM-CRC express inhibitory ligands. Expression of inhibitory ligands PD-L1, galectin 9 (GAL-9), MHC-II, CD86 and CD80 was measured by flow cytometry. (A) The frequencies of CD19+ B cells, BDCA1+CD19− mDC and CD14+ monocytes (Mono) within CD45+ cells derived from tumors, TFL and blood. Values of individual patients are presented, lines depict medians. (B) Representative histograms of inhibitory ligand stainings and isotype controls on tumor-infiltrating mDC, monocytes and B cells. (C) The frequencies of inhibitory ligand positive cells within tumor-infiltrating B cells, mDC and monocytes in individual patients are presented; lines depict medians. (D) The median fluorescence intensities (MFI) of inhibitory ligands on B cells, mDC and monocytes derived from tumors, TFL and blood of LM-CRC patients. Values of individual patients are shown, and lines depict medians. Differences were analyzed by paired t test or Wilcoxon matched pairs test; *p < 0.05, **p < 0.01, ***p < 0.001.
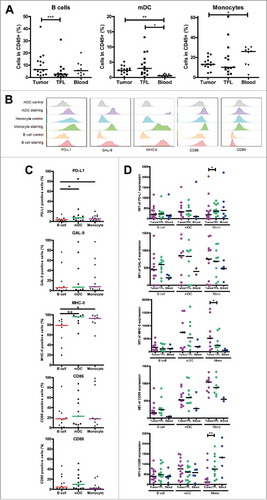
Figure 4. Tumor-infiltrating T cells expressing inhibitory receptors show increased expression of activation markers. TIL from MMR-proficient LM-CRC were stained ex vivo with antibodies against surface activation markers HLA-DR and CD69. (A) (B) The frequencies of HLA-DR+ or CD69+ cells in (A) CD8+ CTL and (B) CD4+ Th that do or do not express PD-1, TIM3, LAG3, or CTLA4 are presented (n = 9–11). Lines show medians, whiskers depict minimum to maximum. Differences were analyzed by paired t test or Wilcoxon matched pairs test. (C) (D) TIL from MMR-proficient LM-CRC were stimulated with PMA and ionomycin at 37°C for five hours, in the presence of protein transport inhibitor brefeldin for the last four hours, followed by intracellular cytokine staining. The frequencies of cytokine-producing cells in (C) CD8+ CTL and (D) CD4+ Th that do or do not express inhibitory receptors are presented (n = 7–12). Lines show medians, whiskers depict Min to Max, boxes indicate the 25th to 75th percentiles. Differences were analyzed by paired t test or Wilcoxon matched pairs test; *p < 0.05, **p < 0.01, ***p < 0.001.
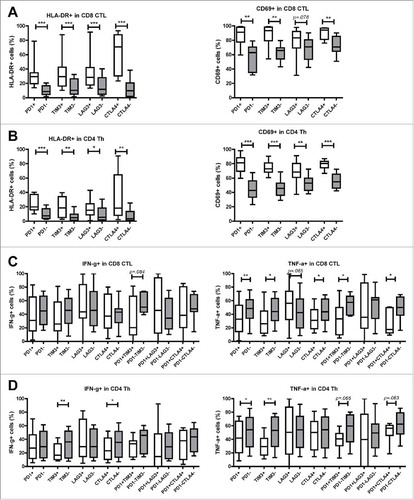
Figure 5. Antibody blockade of LAG3 or PD-L1 boosts ex vivo proliferation and cytokine production of intra-tumoral T cells from MMR-proficient LM-CRC in response to polyclonal stimuli. CFSE-labeled TIL from LM-CRC patients were stimulated with CD3/CD28 beads for four days, in the presence or absence of 10 μg/ml antagonistic antibodies. (A) Representative dot plots of CD3+CD8+ and CD3+CD4+ TIL proliferation in response to CD3/CD28 beads (a-CD3/CD28) in the presence or absence of antagonistic antibodies (a-) or isotype controls (iso ctrl). Dotplots indicated by “TIL” show proliferative responses in the absence of CD3/CD28 beads. In all other conditions, CD3/CD28 beads were added. (B) The percentages of proliferating cells (CFSE-low) within CD8+ and CD4+ T cells derived from the tumor or blood in response to CD3/CD28 beads without addition of any antagonistic antibody. Values of individual patients are presented. (C) Effects of antibody blockade of inhibitory interactions on CD8+ and CD4+ TIL proliferation (n = 7-9). Because the proliferative responses differed between patients, the results are reported as relative proliferation in the presence of antibodies compared to baseline proliferation, which was calculated by dividing the percentages of proliferating (CFSE-low) T cells in the presence of antagonistic antibody or isotype control antibody by the percentages in the control condition with only CD3/CD28 beads. Values are depicted as means with standard error of the mean. (D) IFN-γ and TNF-α accumulation in culture supernatants was quantified at day four by enzyme-linked immunosorbent assay. Values are depicted as medians with interquartile range (n = 10-11). Differences were analyzed by paired t test or Wilcoxon matched pairs test; *p < 0.05, **p < 0.01.
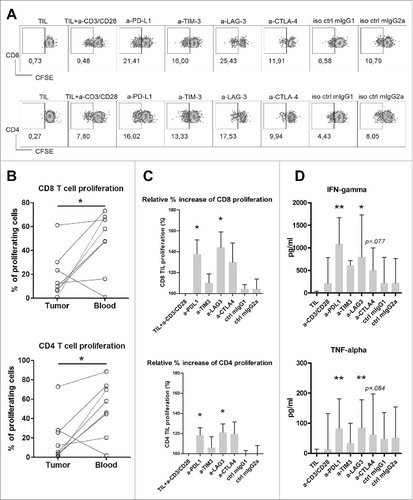
Figure 6. Antibody blockade of LAG3 or PD-L1 boosts ex vivo responses of intra-tumoral T cells from MMR-proficient LM-CRC to autologous tumor antigens. Blood mDC loaded with autologous tumor lysates were used to stimulate CFSE-labeled TIL, in the presence or absence of 10 μg/mL antagonistic antibodies. After six days T cell proliferation and intracellular cytokine production were analyzed after re-stimulation with PMA and ionomycin. (A) (B) Representative dot plots of T cell proliferation, IFN-γ and TNF-α expression in CD3+CD8+ and CD3+CD4+ TIL, in response to autologous mDC pre-loaded with tumor lysates (TIL+mDC+tumor lysate), in the presence or absence of antagonistic antibodies (a-). TIL responses to mDC that were not pre-loaded with tumor lysates (TIL+mDC) served as controls to determine non-antigen-specific TIL proliferation and cytokine production. (C) (D) (E) Collective data of five patients tested. Each line and each color represent one patient. The results are reported as net tumor-specific responses, calculated by subtracting the percentages of proliferating (CFSE-low) T cells or IFN-γ+ or TNF-α+ proliferating T cells in the control condition (mDC without tissue lysates) from the percentages in the conditions with tumor lysates (TL) in the absence or presence of antagonistic antibody. In two experiments an additional control was included, in which TIL were stimulated with blood mDC pre-loaded with normal liver lysates (NL), which did not lead to increased TIL responses.
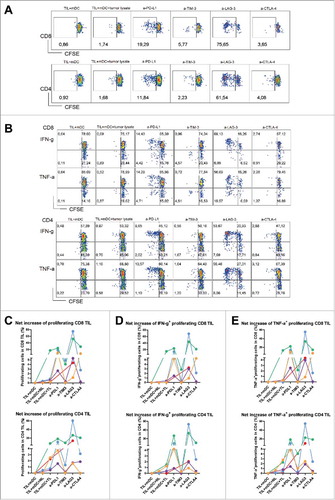
Figure 7. Kaplan-Meier curves of progression-free survival (time to recurrence) in relation to LAG3 expression on intra-tumoral T cells in MMR-proficient LM-CRC. The cutoff values to divide the patients into two groups are the median percentages of LAG3+ cells in tumor-infiltrating CD8+ CTL, CD4+Foxp3− Th or CD4+Foxp3+ Treg cells. For determination of the p values the Breslow test was used.
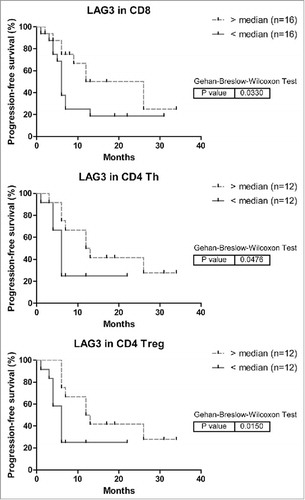
Table 2. Multivariable Cox proportional Hazard regression analysis of progression-free survival of patients with MMR-proficient LM-CRC.