Figures & data
Figure 1. Melanoma cells lose their capacity to stimulate autologous CD8+ TILs in the course of BRAFi treatment. (A) BRAFi (vemurafenib, 0.5 µM) induces apoptosis in Ma-Mel-86c tumor cells after 3 and 7 d of treatment, as measured by flow cytometry. Percentage of Annexin V+ cells is depicted as mean+SEM (n = 3). *, p < 0.05. (B) Staining for senescence-associated β-galactosidase activity in Ma-Mel-86c cells after 3, 7, 14 or 21 d of BRAFi treatment and corresponding non-treated control cells (ctrl). Representative images from one of three independent experiments. (C) Activation of autologous bulk CD8+ TILs by BRAFi-treated cells (3, 7, 14, 21 d) or BRAFi-resistant (Res) Ma-Mel-86c cells was determined by intracellular IFNγ staining. Results are shown as fold change of IFNγ+ CD8+ T cells stimulated by BRAFi-treated tumor cells relative to corresponding untreated tumor cells (n = 3). *, p < 0.05, BRAFi vs ctrl. (D) Surface expression of HLA class I and PD-L1 on Ma-Mel-86c cells after BRAFi treatment (0.5 µM). Data are depicted as ratio of mean fluorescence intensity of HLA-class I to PD-L1 (mean+SEM, n >3). *, p < 0.05, BRAFi vs ctrl.
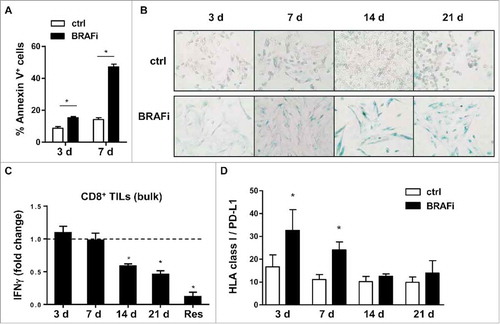
Figure 2. Melanoma antigen-specific CD8+ T cell clones in patient model Ma-Mel-86. (A) Antigen specificity and HLA-restriction of CD8+ T cell clones from patient Ma-Mel-86 used in this study. (B) Detection of T cells with known antigen specificity among TILs from patient Ma-Mel-86. Synthetic peptides-loaded (1 µg/ml) autologous EBV-transformed B cells (auto. EBV-B) were used as antigen-presenting cells and cocultured with TILs for 4 h. Percentage of IFNγ-producing CD8+ TILs was determined by using intracellular cytokine staining and depicted as mean+SEM (n = 3). Non-loading or irrelevant peptide-loaded B cells were used as negative controls.
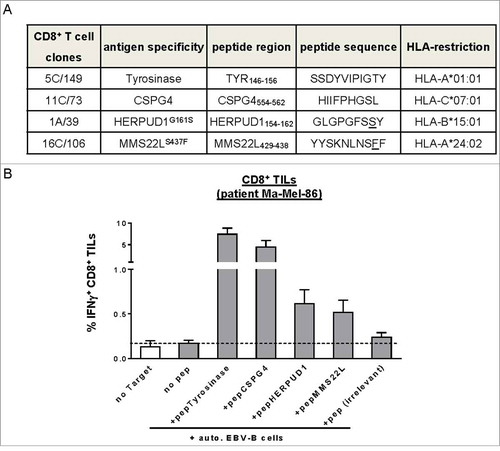
Figure 3. Activation of pre-existing shared antigen-specific CD8+ T cells by BRAFi-treated autologous tumor cells in patient model Ma-Mel-86. (A) Expression of pERK, ERK, Tyrosinase, Melan-A, MITF, HLA heavy chains, and ERAP1 in BRAFi-treated and -untreated Ma-Mel-86c cells was analysed by Western blot. GAPDH served as loading control. Representative data from one of at least two independent experiments. (B) Activation of Tyrosinase-specific CD8+ T cell (CTL) clone 5C/149 and (C) CSPG4-specific CD8+ T cell (CTL) clone 11C/73 by autologous BRAFi-treated (0.5 µM) Ma-Mel-86c cells was determined by IFNγ ELISpot assay. Results are presented as fold change of IFNγ spots from T cells stimulated with BRAFi-treated relative to untreated tumor cells. Data is depicted as mean+SEM (n = 3). *, p < 0.05, BRAFi vs ctrl. (D) Surface expression of CSPG4 on BRAFi-treated Ma-Mel-86c cells was measured by flow cytometry. Unstained tumor cells were used as negative control (light-grey empty lines). Representative data from one of three independent experiments. (E) Activation of antigen-specific CD8+ T cells by BRAFi-treated (0.5 µM for 21 d) Ma-Mel-86c cells was determined by IFNγ ELISpot. Loading of synthetic antigenic peptides (1 µg/ml) or blockade of HLA class I (W6/32, 50 µg/ml) on tumor cells was performed at 37°C for 30 min before T cell stimulation. Results are presented as fold change of IFNγ spot numbers relative to IFNg spots obtained by T cells stimulated with untreated (ctrl) tumor cells. Data is depicted as mean+SEM (n = 3). *, p < 0.05.
Figure 4. Regulation of antigen expression by BRAFi in tumor cells and its impact on Melan-A-specific CD8+ T cell activation in patient model Ma-Mel-63. (A) Expression of pERK, ERK, Tyrosinase, Melan-A, MITF, HLA heavy chains, and ERAP1 in BRAFi (vemurafenib, 0.5 µM)-treated or -untreated BRAFV600E-positive Ma-Mel-63a cells was determined by Western blot. GAPDH served as loading control. Representative data from one of at least two independent experiments. (B) Surface expression of CSPG4 on BRAFi-treated and -untreated (3, 7, 14 or 21 d, filled dark grey) Ma-Mel-63a cells was measured by flow cytometry. Unstained tumor cells were used as negative control (filled light grey). Representative data from one of three independent experiments. (C) Surface expression of HLA-class I and PD-L1 on Ma-Mel-63a cells after BRAFi treatment (0.5 µM). Data are depicted as ratio of mean fluorescence intensity of HLA class I to PD-L1 (mean+SEM, n = 4–5). *, p < 0.05, BRAFi vs ctrl. (D) IFNγ release by Melan-A-specific, HLA-A2-restricted CD8+ T cell clone stimulated with BRAFi-treated or -untreated Ma-Mel-63a cells (HLA-A2+) was determined by ELISA and one representative data from two independent experiments is shown as mean+SEM. (E) Expression of Tyrosinase, Melan-A and MITF in BRAFi-naive or -resistant (Res) Ma-Mel-63a cells was determined by Western blot. GAPDH served as loading control. Representative data from three independent experiments. (F) IFNγ release by Melan-A-specific, HLA-A2-restricted CD8+ T cell clone stimulated with BRAFi-naive or -Res Ma-Mel-63a cells (HLA-A2+) was determined by ELISA and one representative data from two independent experiments is shown as mean+SEM.
Figure 5. BRAFi treatment differentially impacts on neoantigen-specific CD8+ T cell recognition. (A) mRNA levels of HERPUD1 and MMS22 L in Ma-Mel-86c cells after BRAFi treatment (vemurafenib, 0.5 µM) were quantified by qPCR and normalized to endogenous RPLP0 mRNA. Expression levels (mean+SEM, n = 3) are depicted relative to the expression in untreated cells (ctrl). *, p < 0.05, BRAFi vs ctrl. (B) IFNγ release by HERPUD1G161S-specific CD8+ T cell clone 1 A/39 stimulated with BRAFi-treated or -untreated Ma-Mel-86c cells (HLA-B*15:01 transfectant) was determined by ELISA and one representative data from two independent experiments is shown as mean+SEM. Percentage of TNFα+ cells in MMS22LS437F-specific CD8+ T cell clone 16C/106 stimulated with BRAFi-treated or -untreated Ma-Mel-86c cells (HLA-A*24:02 transfectant) was determined by intracellular cytokine staining (mean+SEM, n = 2). *, p < 0.05, BRAFi vs ctrl.
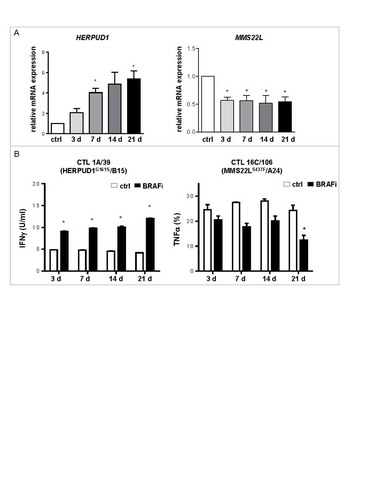
Figure 6. Evolution of T cell resistance in the course of combinatorial BRAFi/MEKi treatment. Activation of autologous bulk CD8+ T cells by BRAFi/MEKi-treated (3, 7, 14, 21 d) or BRAFi/MEKi-resistant (Res) Ma-Mel-86c (A) and Ma-Mel-63a cells (B) was determined by intracellular IFNγ staining. Results are shown as fold change of IFNγ+ CD8+ T cells stimulated by BRAFi/MEKi-treated tumor cells relative to corresponding untreated tumor cells (n = 3). *, p < 0.05, BRAFi/MEKi vs ctrl. (C, D) Expression of pERK, ERK, Tyrosinase, Melan-A, and MITF in BRAFi/MEKi-treated or -untreated Ma-Mel-86c (C) and Ma-Mel-63a (D) cells was determined by Western blot. GAPDH served as loading control. Representative data from one of at least three independent experiments.