Figures & data
Figure 1. δ-Catenin might be a potential target for designing cancer peptide vaccines. (A) H22 cells were treated by 2% O2 or 8 Gy ionization irradiation for 6 h. The mRNA levels of Ctnnd2 were examined by qRT-PCR. (B) The amino acid sequences of δ-Catenin were aligned with sequences of δ-Catenin peptide vaccines by Invitrogen AlignX.
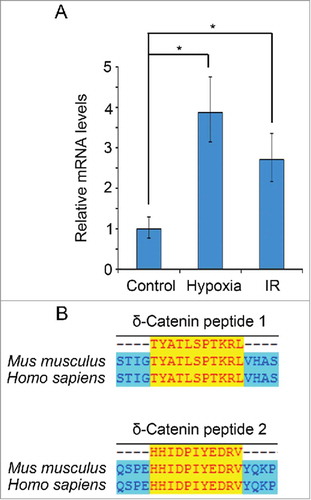
Figure 2. δ-Catenin peptide vaccines could inhibit the growth of subcutaneous tumors formed by liver cancer cells. (A-B) Experimental design of the therapeutic model for examining the functions of δ-Catenin peptide vaccines in vivo. (C) 5×10⁵ H22 cells were injected subcutaneously into ICR mice. δ-Catenin peptide vaccine 1, peptide vaccine 2 or combined vaccines were immunized as shown in (A). Tumor sizes were measured and tumor volumes were calculated at the indicated time to draw the curves (*P < 0.05, **P < 0.01). (D) 5×10⁵ Hepa1-6 cells were injected subcutaneously into C57 BL/6 mice. δ-Catenin peptide vaccine 1 and peptide vaccine 2 were combined to be immunized as shown in (B). Tumor sizes were measured and tumor volumes were calculated at the indicated time to draw the curves (*P < 0.05, **P < 0.01). (E) ICR mice were sacrificed at Day 24 as shown in (A). Tumor were harvested and tumor weights were measured (*P < 0.05, **P < 0.01). (F) C57 BL/6 mice were sacrificed at Day 24 as shown in (B). Tumor were harvested and tumor weights were measured (*P < 0.05, **P < 0.01). (G) ICR mice were sacrificed at Day 24 as shown in (A). Tumors harvested were shown. (H) C57 BL/6 mice were sacrificed at Day 24 as shown in (A). Tumors harvested were shown.
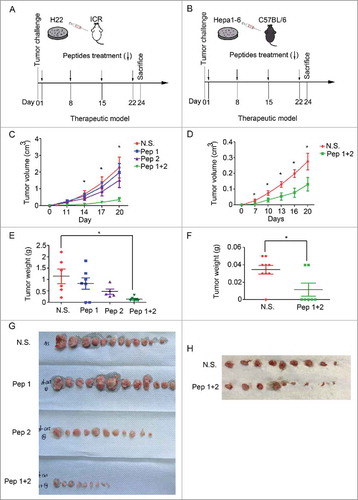
Figure 3. δ-Catenin peptide vaccines might stimulate the activation of CTLs in PB and the infiltration of CTLs in tumors to have the anti-tumor effect. (A-B) ICR mice were sacrificed at Day 24 as shown in . Peripheral blood was harvested. The percentages of CTLs were examined by flow cytometry. (C-D) C57 BL/6 mice were sacrificed at Day 24 as shown in . Peripheral blood was harvested. The percentages of CTLs were examined by flow cytometry. (E) ICR mice were sacrificed at Day 24 as shown in . Tumors were homogenized in PBS to be the lysates with a concentration of 10 mg/mL proteins. The concentration of IFN-γ in tumor lysates was measured by Elisa. (F) C57 BL/6 mice were sacrificed at Day 24 as shown in . Tumors were homogenized in PBS to be the lysates with a concentration of 10 mg/mL proteins. The concentration of IFN-γ in tumor lysates was measured by Elisa. (G-H) ICR mice were sacrificed at Day 24 as shown in . Tumors were harvested and the infiltration of CD8+ T cells was measured by immunofluorescence.
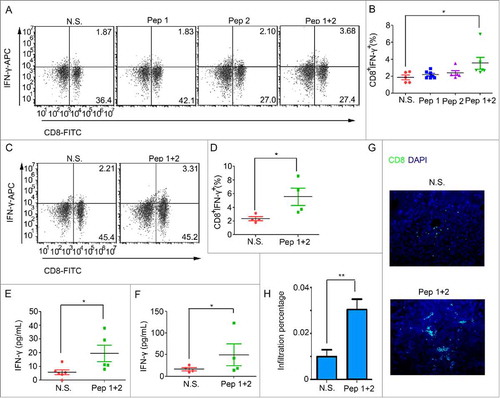
Figure 4. δ-Catenin peptide vaccines could stimulate the activation of CTLs in vitro. (A-B) Lymphocytes from ICR mice were cultured in vitro with different treatment for 48 h. The percentages of CTLs were examined by flow cytometry. (C-D) CD3+ T cells and CD3− APCs from ICR mice were isolated by FACS. T cells and APCs were co-cultured with different treatment in vitro for 48 h. The percentages of CTLs were examined by flow cytometry. (E-F) Lymphocytes from C57 BL/6 mice were cultured in vitro with different treatment for 48 h. The percentages of CTLs were examined by flow cytometry. (G-H) CD3+ T cells and CD3− APCs from C57 BL/6 mice were isolated by FACS. T cells and APCs were co-cultured with different treatment in vitro for 48 h. The percentages of CTLs were examined by flow cytometry.
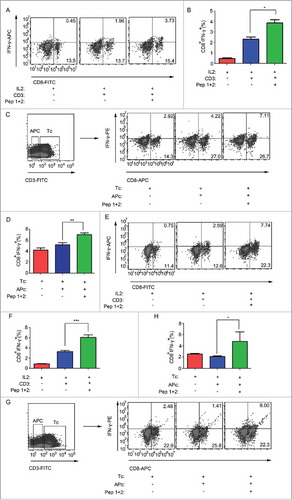
Figure 5. δ-Catenin peptide vaccines could enhance the killing activity of T cells in vitro. (A) Lymphocytes from ICR mice were cultured in vitro with different treatment for 48 h. The concentration of IFN-γ in supernatant was measured by Elisa. (B) CD3+ T cells and CD3- APCs from ICR mice were isolated by FACS for 48 h. T cells and APCs were co-cultured with different treatment in vitro. The concentration of IFN-γ in supernatant was measured by Elisa. (C) Lymphocytes from ICR mice were cultured in vitro with different treatment for 48 h. Then lymphocytes were co-cultured with H22 cells as the ratio 1:1, 5:1, 10:1, 25:1 and 50:1 for 4 h. The cell killing efficiency of lymphocytes was measured by examining the relative LDH released levels in the supernatant. (D) Lymphocytes from C57 BL/6 mice were cultured in vitro with different treatment for 48 h. The concentration of IFN-γ in supernatant was measured by Elisa. (E) CD3+ T cells and CD3- APCs from C57 BL/6 mice were isolated by FACS for 48 h. T cells and APCs were co-cultured with different treatment in vitro. The concentration of IFN-γ in supernatant was measured by Elisa. (F) Lymphocytes from C57 BL/6 mice were cultured in vitro with different treatment for 48 h. Then lymphocytes were co-cultured with Hepa1-6 cells as the ratio 1:1, 5:1, 10:1, 25:1 and 50:1 for 4 h. The cell killing efficiency of lymphocytes was measured by examining the relative LDH released levels in the supernatant.
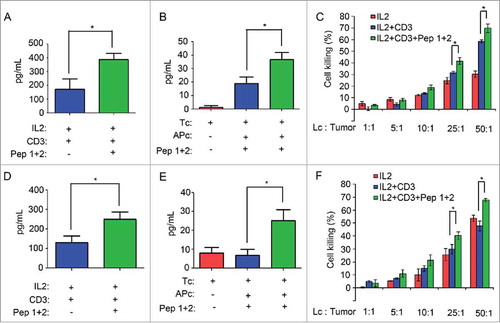
Figure 6. δ-Catenin peptide vaccines enhanced the activation of CD8+ T cells via the activation of ERK signaling(A) Lymphocytes from ICR mice were cultured in vitro with different treatment for 1 h. Then the CD8+ T cells were isolated by FACS. (B) Cell lysates of CD8+ T cells from were indicated to immunoblotting. (C) Lymphocytes from ICR mice were cultured in vitro with different treatment for 4 h. Then the CD8+ T cells were isolated by FACS. The mRNA levels of T-bet were examined by qRT-PCR. (D) Lymphocytes from ICR mice were cultured in vitro with different treatment for 4 h. Then the CD8+ T cells were isolated by FACS. The mRNA levels of Eomes were examined by qRT-PCR. (E) Lymphocytes from C57 BL/6 mice were cultured in vitro with different treatment for 1 h. Then the CD8+ T cells were isolated by FACS. (F) Cell lysates of CD8+ T cells from were indicated to immunoblotting. (G) Lymphocytes from C57 BL/6 mice were cultured in vitro with different treatment for 4 h. Then the CD8+ T cells were isolated by FACS. The mRNA levels of T-bet were examined by qRT-PCR. (H) Lymphocytes from C57 BL/6 mice were cultured in vitro with different treatment for 4 h. Then the CD8+ T cells were isolated by FACS. The mRNA levels of Eomes were examined by qRT-PCR.
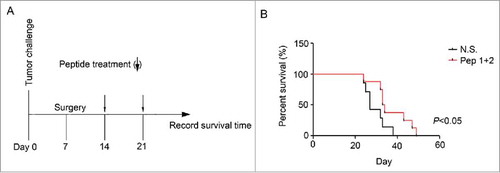
Figure 7. δ-Catenin peptide vaccines prolonged the survival time of mice after tumors were resected (A) Experimental design of the therapeutic model for examining the functions of δ-Catenin peptide vaccines in vivo. (B) Death of mice in were recorded and survival curves were drawn.