
Figures & data
Figure 1. Genomic Organization of ADORA2A and NT5E. Shown are regulatory elements, CG-density, transcripts, transcription start sites (TSSs) and locations of beads (numbered consecutively according to their position) within the ADORA2A (A) and NT5E (B) gene locus. The modified illustration was exported from www.ensemble.org (Version 89.38) and is based on Genome Reference Consortium Human Build 38 patch release 10 (GRCh38.p10).
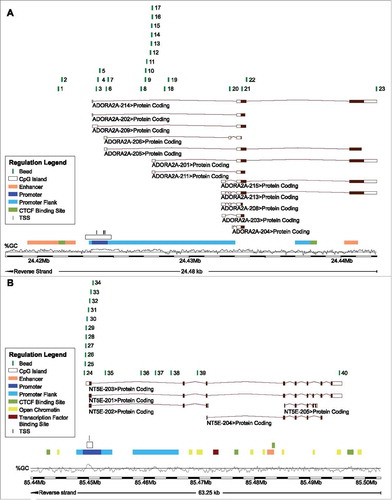
Figure 2. ADORA2A methylation and A2aR mRNA expression in leucocyte subtypes. A) Mean methylation of CD8+ T, CD4+ T, Treg, B cells, and monocytes as well as HPV-positive and HPV-negative cell lines at different loci within ADORA2A targeted by beads from the Infinium HumanMethylation450 BeadChip. B) A2aR mRNA expression in monocytes, B, CD4+, and CD8+ T cells. Asteriks imply a significant difference between two groups (*: p°<°0.05, **: p°<°0.001). C-E) Exemplarily illustrated methylation levels at three different loci within ADORA2A in monocytes, CD8+ T, CD4+ T, Treg, B cells, and HPV-positive and HPV-negative cell lines. Mean values and 95% confidence intervals are given (depicted in red).
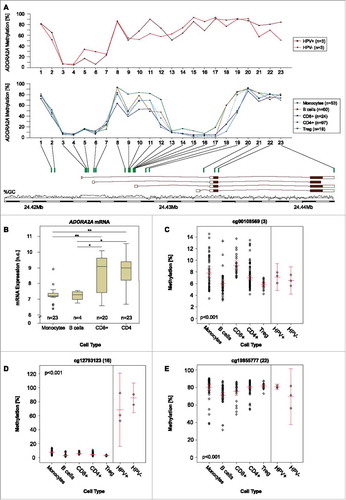
Figure 3. NT5E methylation and CD73 mRNA expression in leucocyte subtypes. A) Mean methylation of CD8+ T, CD4+ T, Treg, B cells, and monocytes as well as HPV-positive and HPV-negative cell lines at different loci within NT5E targeted by beads from the Infinium HumanMethylation450 BeadChip. B) A2aR mRNA expression in monocytes, B, CD4+, and CD8+ T cells. Asteriks imply a significant difference between two groups (*: p°<°0.05, **: p°<°0.001). C-D) Exemplarily illustrated methylation levels at two different loci within NT5E in monocytes, CD8+ T, CD4+ T, Treg, B cells, and HPV-positive and HPV-negative cell lines. Mean values and 95% confidence intervals are given (depicted in red).
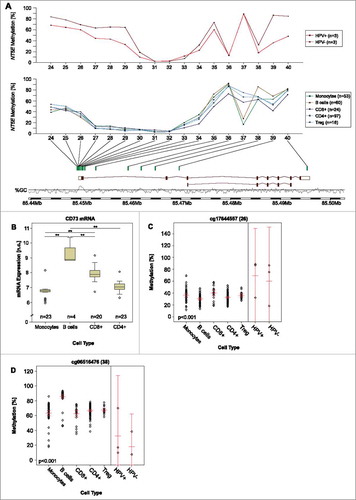
Table 1. Correlations of mRNA expression and methylation in peripheral lymphocytes. Shown are correlations between mRNA expression and DNA methylation at various loci within the ADORA2A and NT5E genes targeted by Infinium HumanMethylation450 BeadChip beads. Immune cell data were adopted by data sets GSE87650 and GSE71245.41,42 Significant features are shown in boldface.
Table 2. Clinicopathological characteristics of HNSCC patients included in the study (n = 279). Shown are normalized counts of A2aR and CD73 mRNA. Significant features are shown in boldface.
Table 3. Detailed analysis of ADORA2A methylation and A2aR mRNA in HPV-positive and HPV-negative patients. Shown are differences between normal adjacent tissue (NAT) and tumor tissue and correlations between methylation and mRNA expression in tumor tissues by single Infinium HumanMethylation450 BeadChip bead resolution. Methylation data for NAT were available for 50 patients (six belonging to the HPV-positive cohort), while mRNA expression data for NAT were assessable for 20 individuals (two belonging to the HPV-positive cohort).Significant features are shown in boldface.
Table 4. Detailed analysis of NT5E methylation and CD73 mRNA in HPV-positive and HPV-negative patients. Shown are differences between normal adjacent tissue (NAT) and tumor tissue and correlations between methylation and mRNA expression in tumor tissues by single Infinium HumanMethylation450 BeadChip bead resolution. Methylation data for NAT were available for 50 patients (six belonging to the HPV-positive cohort), while mRNA expression data for NAT were assessable for 20 individuals (two belonging to the HPV-positive cohort). Significant features are shown in boldface.
Figure 4. Results for individual BeadChip beads of ADORA2A and NT5E. Results of a detailed analysis of methylation for the genes ADORA2A (A and B) and NT5E (C and D) at single bead resolution with regard to the HPV-status are pictographically displayed (methylation differences between normal adjacent tissue (NAT) and tumor tissue, correlations between mRNA expression and methylation, and association with survival are shown, for exact values see –). Significant results are depicted in red. The beads are numbered according to .
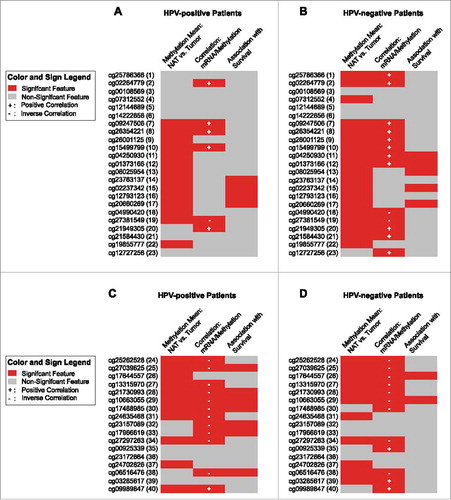
Figure 5. Association of ADORA2A methylation and A2aR mRNA expression with survival. Kaplan-Meier survival analyses of patients with HPV-positive (A) and –negative (B) tumors stratified according to A2aR mRNA expression and ADORA2A methylation determined at various sites within the gene. Median methylation and mRNA expression was used as cut-off for classifying tumors as hypo- and hypermethylated, or high and low expressing, respectively. Shown are only significant results.
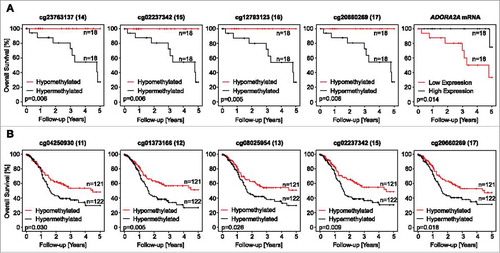
Table 5. Kaplan-Meier analysis of ADORA2A methylation, A2aR mRNA, NT5E methylation, and CD73 mRNA in HPV-positive and HPV-negative patients. Subcohorts are dichotomized by their median. Thus, in the HPV-positive cohort subgroups (“hypomethylated” and “hypermethylated”) consist of 18 patients each, while in the HPV-negative cohort hypomethylated and hypermethylated subgroups consist of 121 and 122 individuals, respectively. Significant features are shown in boldface.
Figure 6. Association of NT5E methylation and CD73 mRNA expression with survival. Kaplan-Meier survival analyses of patients with HPV-positive (A) and –negative (B) tumors stratified according to CD73 mRNA expression and NT5E methylation determined at various sites within the gene. Median methylation and mRNA expression was used as cut-off for classifying tumors as hypo- and hyper methylated, or high and low expressing, respectively. Shown are only significant results.
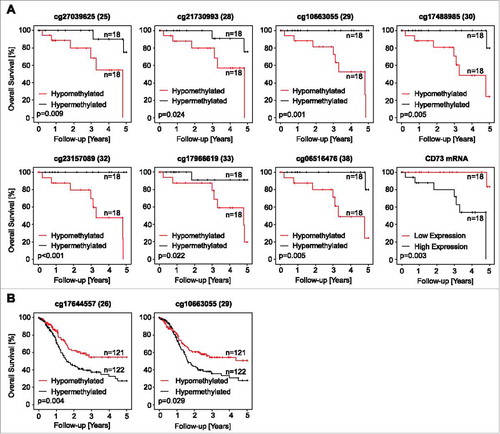
Table 6. Correlation of A2aR mRNA and CD73 mRNA with T cell activation markers. Spearman‘s rank between A2aR mRNA and CD73 mRNA expression with mRNA expression of genes that are commonly induced during T cell activation. Significant features are shown in boldface.