
Figures & data
Figure 1. Characterization of the immunological properties of the B16.OVA model and its suitability for immune checkpoint inhibition studies. A) B16.OVA melanoma cells were incubated for 24 hours with or without murine IFNγ. On the following day cells were stained for the presence of PD-L1 and analyzed by flow cytometry. An isotype antibody served as negative control. The percentage of PD-L1+ positive cells (left panel) and the geometrical mean fluorescence intensity (gMFI; right panel) are plotted as the mean ± SEM. B) Analysis of immunological samples collected from C57 BL/6 J female mice engrafted with B16.OVA tumors. The expression of the marker PD-1 on the surface of CD3+CD4+ and CD3+CD8+ tumor infiltrating cells (left panel). PD-1 expression on CD3+CD8+ cells in different organs. Statistics are done by using the Student´s t-test; *** p < 0,001, **** p < 0,0001. C) Activated (Act) (PD-1+TIM3-) or Exhausted (Exh) (PD-1+TIM-3+) lymphocytes were defined within the CD4+ or CD8+ populations by flow cytometry. The Pearson´s coefficient of correlation between all populations was then calculated. A positive coefficient represents a positive correlation, while a negative coefficient represents a negative correlation.
Figure 2. Combination of oncolytic vaccines and PD-L1 blockade increases the response to checkpoint inhibition. B16.OVA bearing female C57 BL/6 J mice (n = 7–8) were treated with saline solution (mock), OVA-PeptiCRAd oncolytic vaccine (day 6, 8 and 10, sub-cutaneously), 100 ug of anti-PD-L1 blocking antibody (aPD-L1) three times per week or a combination of the two monotherapies (Combo). A) Tumor volumes are plotted as the mean ± SEM. B) The area under the curves relative to the tumor growth of mice was calculated and plotted as the mean ± SEM. C) At day 28 long-term survivors were re-challenged on the left flank with B16 melanoma tumor cells (300000 cells/mouse). Volumes of the secondary tumors of long-term survivors are presented as mean ± SEM. E) Survival curve relative to the experiment presented in A. The percentage of tumor-free mice is indicated for aPD-L1 and Combo groups. The median survival of each group is reported in the table below the graph. F) The volumes of the primary tumors at day 35 are reported for each mouse to define the responders VS non-responders. Threshold of 1000 mm3 was set to define the response. The percentage of responders is reported below the x axis. G) C57 BL/6 J mice pre-immunized with the oncolytic adenovirus (PEI-COMBO) or naïve mice (Combo) were engrafted with B16.OVA tumor cells (n = 10). Both groups received the combination of oncolytic vaccine PeptiCRAd and aPD-L1 with standard regiment used previously. Tumor volume is presented as the mean ± SEM. H) Survival of the groups is presented and median survival reported. For tumor growth curves statistic were calculated by Two-Way ANOVA with Tukey´s post-test. The log rank Mantel-Cox analysis was used to calculate the p value of the survival curves. For the bar graphs the Student´s t-test was used. *p < 0.05, **p < 0.005, ***p < 0,001, ****p < 0,0001.
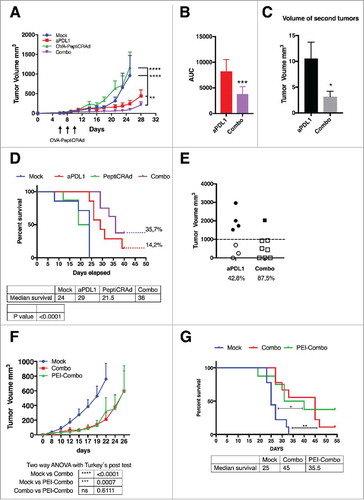
Figure 3. Induction of antigen specific cells by oncolytic vaccines synergizes with the inhibition of PD-1/PD-L1 interactions reshaping the immunological background. Tumor samples were collected from mice treated with the aPD-L1+OVA-PeptiCRAd combination presented in . CD3+CD8+ tumor infiltrating lymphocytes were evaluated for antigen specificity (SIINFEKL-Pentamers) and their state (PD-1 and TIM-3 expression) by flow cytometry. A) Percentages of single positive PD-1+ (blue) or TIM-3+ (red) or double positive PD-1+TIM-3+ (green) CD8+ TILs are plotted by Tukey box and whiskers for each group of animals. Analysis done by Two-Way ANOVA. B) The percentage of OVA specific CD8+ TILs was assayed by Pentamer Staining and it is plotted as the mean ± SEM. Analysis done by One-way ANOVA C) The ratio between Activated (PD-1+) and Exhausted (PD-1+TIM-3+) OVA-specific CD8+ TILs was calculated for each mouse. The ratio is reported on top of each bar. A statistical test was performed to assess if the ratio was significantly different than 1. The p-values for each group are reported below the graph.
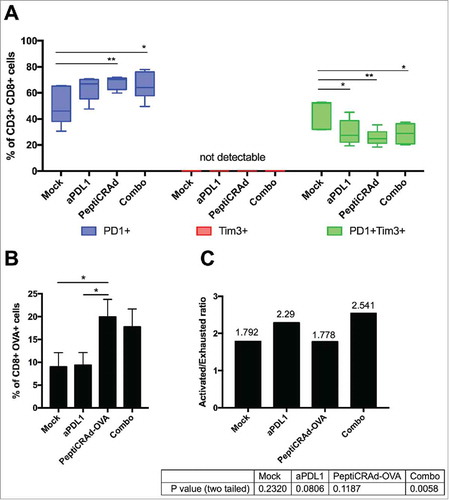
Figure 4. Antitumor activity of different PeptiCRAd formulations and immunological background analysis. (A) Balb/c mice (n = 7) received 3 × 10⁵ 4T1 cells in the right flank. Treatments were initiated on established tumor (9 days after implantation) and the mice were treated three times (on days 9, 11 and 13, black arrow). The average volume is represented in the tumor´s growth curve as mean ± SEM (statistical analysis 2way ANOVA with Tukey´s multiple comparisons test. *p < 0.05). (B) PD-L1 level in 4T1 are reported. The cells were stimulated with INFγ overnight. On the following day, the cells were stained for PD-L1 and analyzed by flow cytometry. The percentage of PD-L1 positive cells (left panel) and the geometrical mean fluorescence intensity (gMFI; right panel) are plotted as the mean ± SEM (statically analysis unpaired t-test. p < 0.05). C) PD-L1 level in tumor from mice bearing 4T1 tumor is described. The percentage of PD-L1+ positive cells (left panel) and the geometrical mean fluorescence intensity (gMFI; right panel) are plotted as the mean ± SEM. D) PD-1+ T cell infiltration in tumors, spleens and lymph nodes from mice bearing 4T1 tumor is shown (statically analysis unpaired t-test. p < 0.05). The flow cytometry analysis was performed in tumor, spleen and lymph node samples collected from mice and frozen. We used anti-mouse PE-PD-1, anti-mouse Percp/Cy5.5 CD3ϵ, anti-mouse FITC-CD8 and anti-mouse APC- CD4. The percentage of PD-1 positive cells is plotted as the mean ± SEM (statically analysis unpaired t-test. p < 0.05).
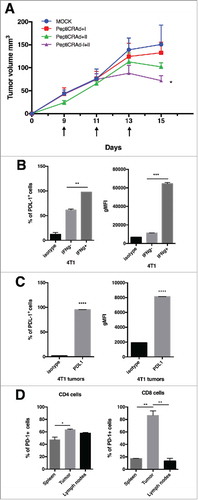
Figure 5. Anti-tumor activity PD-L1 blockade and PeptiCRAd mediated and immune modulation in tumor microenvironment. (A) The single tumor growth curves for single mouse and one graph for each group are reported (n = 10 animals per group). Responders are defined in percentage (displayed next to each graph) as mice that show an absolute volume lower than 200 mm3. (B) Flow cytometry analysis of CD4 and CD8T cells in tumor samples from the animal groups is presented. (C) At the end of the experiment the tumors were collected and analyzed for the PMN-MDSCs infiltration. The analysis was executed considering the intermediate value of Ly6C+ signal, identifying the neutrophil population as as Ly6Ghigh and Ly6C intermediate/high. (D) Human PBMCs HLA matched with tumor cell lines were pulsed with PeptiCRAd-MAGEA1 (for SM-MEL-2) or PeptiCRAd-MAGEA4 (for MDA-MB-436) in presence of human IL2. After 2 days, the PBMCs were added to target tumor cell lines, in presence or not of anti-PD-L1 antibody. After 5 days cell viability was measured and the percentage of killing was calculated. Results are presented as the mean ± SEM. Statistical significance was calculated with the Student´s t-tests; *p < 0,05.
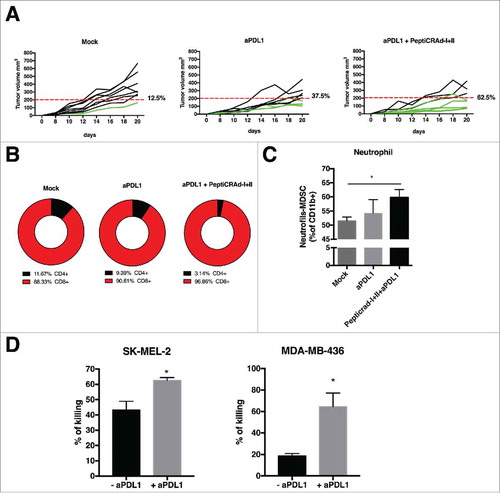
Table 1. HLA genotyping analysis in MDA-MB-436.