
Figures & data
Figure 1. Tumor development characteristics of parental versus hyperploid MCA205 cells in WT and Rag2−/− mice. Parental and hyperploid MCA205 cells were inoculated into C57BL/6 or Rag2−/− mice. Tumor incidence (A) and tumor growth (B, independent mice, and C, average of all mice) were routinely monitored. Histological sections from parental and hyperploid tumors recovered from C57BL/6 mice, Rag2−/− mice were submitted to histochemical staining for the detection of nuclear area (D). Scale bar, 10 μm. Inserts in D show representative pictures. Box plots represent median values of nuclear areas (median applied to each mouse, normalized by the average of the parental median value). Tumor incidence was compared by one-tailed Barnard's test, tumor growth curves were analyzed with Wald test and nuclear area were compared by means of a linear mixed model (see Statistical Analysis in Materials and Methods). *p < 0.05 P vs H; ***p < 0.01 P vs H; ¥ p < 0.05 P vs WT; ## p < 0.01 H vs WT; ### p < 0.001 H vs WT. Error bars represent SEM over time.

Figure 2. Tumor development characteristics of parental versus hyperploid EL4 cells in WT and Rag2−/− mice. Parental and hyperploid EL4 cells were inoculated into C57BL/6 or Rag2−/− mice. Tumor incidence (A) and tumor growth (B, independent mice, and C, average of all mice) were routinely monitored. Histological sections from parental and hyperploid tumors recovered from C57BL/6 mice, Rag2−/− mice were submitted to histochemical staining for the detection of nuclear area (D). Scale bar, 10 μm. Inserts in D show representative pictures. Box plots represent median values of nuclear areas (median applied to each mouse, normalized by the average of the parental median value). Tumor incidence was compared by one-tailed Barnard's test, tumor growth curves were analyzed with Wald test and normalized nuclear area were compared by means of a linear mixed model (see Statistical Analysis in Materials and Methods). *p < 0.05 P vs H; ***p < 0.001 P vs H; # p < 0.001 H vs WT; ### p < 0.001 H vs WT. Error bars represent SEM over time.
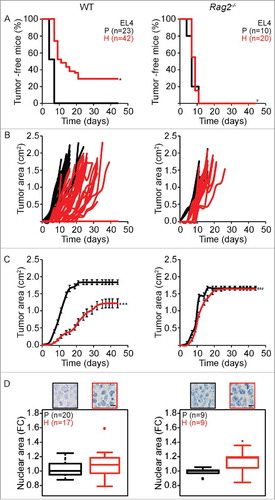
Figure 3. Characteristics of tumor development of parental versus hyperploid MCA205 cells in different immunodeficient mice. Parental and hyperploid MCA205 cells were inoculated into CD1d−/−, Ighmtm1Cgn , FcRn−/− or Myd88−/− mice. Tumor incidence (A) and tumor growth (B, independent mice, and C, average of all mice) were routinely monitored. Histological sections from parental and hyperploid tumors recovered from CD1d−/−, Ighmtm1Cgn , FcRn−/− and Myd88−/− mice were submitted to histochemical staining for the detection of nuclear area (D). Box plots represent median values of nuclear areas (median applied to each mouse, normalized by the average of the parental median value). Tumor incidence was compared by one-tailed Barnard's test, tumor growth curves were analyzed with Wald test and normalized nuclear area were compared by means of a linear mixed model (see Statistical Analysis in Materials and Methods). *p < 0.05 P vs H; **p < 0.01 P vs H; ***p < 0.001 P vs H. Error bars represent SEM over time.
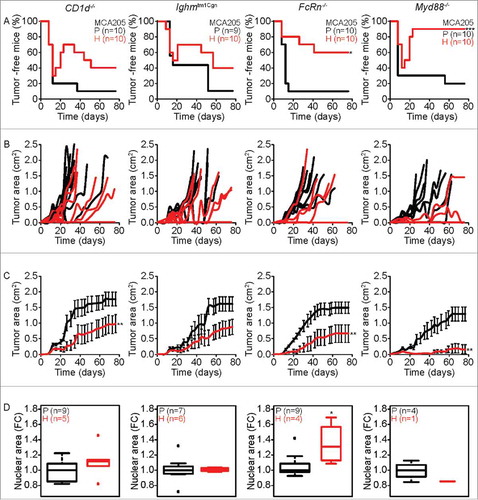
Figure 4. Characteristics of tumor development of parental versus hyperploid EL4 cells in mice with different immunodeficiencies. Parental and hyperploid EL4 cells were inoculated into Foxn1nu/nu, Flt3l−/− , Nlrp3−/− mice or mice treated with the IL-1 receptor antagonist Anakinra. Tumor incidence (A) and tumor growth (B, independent mice, and C, average of all mice) were routinely monitored. Histological sections from parental and hyperploid tumors recovered from Foxn1nu/nu, Flt3l−/− , Nlrp3−/− mice or mice treated with Anakinra were submitted to histochemical staining for the detection of nuclear area (D). Box plots represent median values of nuclear areas (median applied to each mouse, normalized by the average of the parental median value). Tumor incidence was compared by one-tailed Barnard's test, tumor growth curves were analyzed with Wald test and normalized nuclear area were compared by means of a linear mixed model (see Statistical Analysis in Materials and Methods). *p < 0.05 P vs H; ***p < 0.001 P vs H; ## p < 0.01 H vs WT. Error bars represent SEM over time.
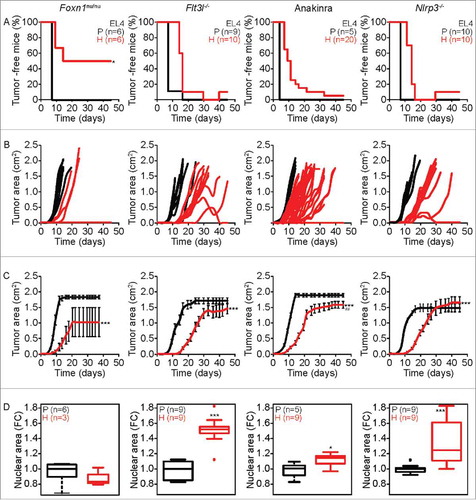
Table 1 . Summary of results (p-values).