
Figures & data
Figure 1. Immunohistochemical images of PD-1 and PD-L1 staining in colorectal cancer. Sample immunohistochemical images (20x magnification) of (A) PD-1 expression in immune cells, (B) PD-L1 expression in both immune cells and tumour cells, and (C) PD-L1 expression mainly in tumour cells. Unfilled arrows indicate immune cells and filled arrows indicate tumour cells.
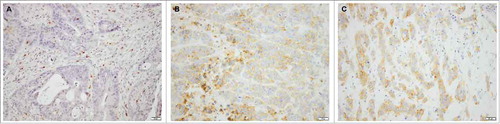
Table 1. Associations between PD-1 expression in immune cells and clinicopathological and investigative factors stratified by primary tumour location.
Table 2. Associations between PD-L1 expression in immune cells and clinicopathological and investigative factors stratified by primary tumour location
Table 3. Associations between PD-L1+ tumour cell expression and clinicopathological and investigative factors stratified by primary tumour location
Figure 2. Kaplan–Meier estimates of overall survival according to immune cell-specific PD-1 and PDL-1 expression and tumour cell-specific PD-L1 expression, and primary tumour location. Kaplan-Meier analysis of 5-year overall survival in strata of 0–9 %, 10–49 %, and 50–100 % immune cells positive for PD-1 (A, B, C) and PD-L1 (D, E, F) staining, and <1 %, 1–4 %, 5–9 %, 10–49 %, and 50–100 % tumour cells positive for PD-L1 staining (G, H, I), in right-sided (first row) and left-sided (second row) colon cancers, and rectal cancer (third row).
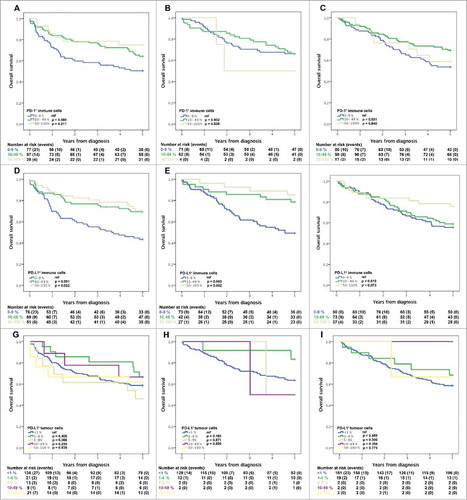
Table 4. Cox proportional hazards models for 5-year overall survival in relation to immune cell-specific PD-1 and PD-L1 expression, and tumour cell-specific PD-L1 expression