Figures & data
Figure 1. Cell death induction & ATP release under MTX or DOXO treatment. Wild-type (CHL-1 & C8161) and oncogenic (A375 & G361) BRAF melanoma cell lines were treated with 1 μM MTX or 5 μM DOXO and cell death was evaluated at 24 h by flow cytometric analysis as percentage of sub-G1 population of PI-stained cells. CHL-1 (B) and A375 (C) cells were treated with 1 μM MTX or 5 μM DOXO (8 h) and ATP release into cell medium was evaluated by a luciferase-based assay. Data represent average and S.D. of 3 independent experiments. (D) Representative fluorescent micrograph from GFP-LC3 expressing CHL-1 melanoma cells treated with vehicle or 1 μM MTX or 5 μM DOXO for 2 or 4 h, and autophagic rate was evaluated by LC3-GFP puncta accumulation (in presence of 5 nM Bafilomycin A) by confocal microscopy; HBSS medium (STV) was used as positive control (bar = 10 μm). (E) Transient down-regulation of BECN1 in CHL-1 cells was evaluated by means of qRT-PCR (left panel); silenced cells were treated as in B in presence or absence of 10 μM Z-VAD-FMK and ATP was evaluated as described above (right panel, histograms reported represent the ratio of released ATP between treated and control samples in both control (siCTRL, white) and BECN1 silenced (siBECN1, black) cells (C = Control; M = MTX; D = DOXO). (n = 3; * = p < 0,05).
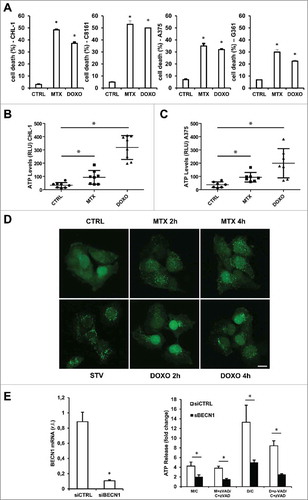
Figure 2. MTX or DOXO treatment favor HMGB1 release. (A) Wild-type (CHL-1) and oncogenic (A375) BRAF melanoma cell lines were treated with 1 μM MTX or 5 μM DOXO (24 h) and the presence of HMGB1 in growth medium was evaluated by means of western blotting analysis; cell lysate (CL) was used as positive control; (B) CHL-1 and A375 were treated 6 h as in A and IL-1β expression was evaluated by both western blot (THP-1 cells treated with LPS were used as positive control) and qRT-PCR; (C) CHL-1 (left) and A375 (right) were treated as in A for 8, 12 and 16 h and HMGB1 and PARP (full length, FL, and caspase-cleaved fragment, CL) were evaluated by western blotting; Gapdh was used as loading control in all reported experiments. (n = 3).
Figure 3. ER stress status and CRT exposure on cell surface after pro-ICD drugs treatment. (A) BRAF-mediated ER-stress was evaluated in both wild-type (CHL-1, C8161 and MeWo) and oncogenic (A375, A2058 and G361) BRAF melanoma cell lines by measuring the levels of the ER stress markers TRB3, CHOP and calreticulin (CRT) by qRT-PCR; (B) ecto-CRT basal level was evaluated in a panel of wild-type (CHL-1, C8161 and MeWo) and oncogenic (A375, A2058 and G361) BRAF melanoma cell lines by flow cytometry; (C) CRT exposure on cell surface was analyzed in CHL-1 and A375 cells under MTX (1 μM) or DOXO (5 μM) exposure (6 h) by means of flow cytometry; representative histograms are shown. (n = 3; * = p < 0,05).
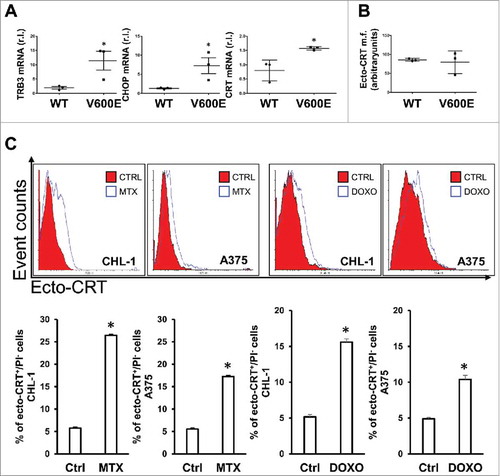
Figure 4. MTX- and DOXO- induced Type I IFN gene upregulation. IFN-α (A) and IFN-β (B) mRNA levels were quantified in CHL-1, C8161, A375 and G361 cell lines treated or untreated (8 h) with MTX (1 μM) or DOXO (5 μM) by qRT-PCR. (C) The downstream type I IFN target CXCL10 expression was evaluated in the same experimental conditions used in A&B, in the indicated cell lines, by qRT-PCR. (D) the release of both IFN-α and IFN-β was evaluated in the cell culture media in the indicated cells treated as in A and B. (n = 3; * = p < 0,05).
Figure 5. ER-stress independent eIF2α phosphorylation in response to MTX/DOXO treatment. The phosphorylation of eIF2α (eIF2α-P) and PERK (PERK-P) were evaluated in CHL-1 (A) and A375 (B) after MTX (1 μM) or DOXO (5 μM) exposure (3 and 6 h), by western blotting analysis (HSP90 was used as loading control), thapsigargin (TG, 10 μg/ml, 6 h) was used as positive control (n = 3); densitometry values of eIF2α phosphorylation ratio between treated samples and controls are reported. Relative levels (mRNA) of the ER stress markers TRB3 and Xbp-1 (spliced, mature form) were measured by qRT-PCR in cells treated as in A and B; thapsigargin (TG, 10 μg/ml, 6 h) was used as positive control (n = 3). The expression of HRI (D), GCN2 (E) or PKR (F) was down-regulated in CHL-1 cells by lentiviral infection (shHRI, or shPKR, G; scrambled shCTRL was used as control) or by siRNA transient transfection (GCN2 or CTRL siRNA oligos) and specific gene silencing was evaluated by qRT-PCR (upper panels) (n = 3); western blotting analysis was used to evaluate the role of each kinase on eIF2α phosphorylation upon MTX (1 μM) or DOXO (5 μM) treatment (6 h) (bottom panels); densitometry values of eIF2α phosphorylation ratio between treated samples and controls are reported. (G) Concomitant down-regulation of GCN2 (siGCN2) and PKR (shPKR) was performed in CHL-1 cells and qRT-PCR was performed to evaluate the efficacy of GCN2 and PKR down-regulation (upper panel; n = 3); subsequently, cells were treated with MTX (1 μM) or DOXO (5 μM) for 6 h and the phosphorylation of eIF2α was evaluated by western blotting (bottom panel); densitometry values of eIF2α phosphorylation ratio between treated samples and controls are reported. HSP90 or Tubulin was used as loading control in all experiments (n = 3; p < 0.05).
Figure 6. Gadd34 regulates the eIF2α/eIF2α-P ratio in cells treated with MTX but not with DOXO. CHL-1 and A375 cells were treated or untreated with MTX (1 μM) or DOXO (5 μM), as indicated, and Gadd34 (A), ATF4 (B and D) and CHOP expression levels were evaluated by qRT-PCR or western blotting analysis; TG (10 μg/ml, 6 h) was used as positive control (n = 3; * = p < 0,05). (E) CHL-1 cells treated 3 h as indicated and the expression levels of eIF2α-P were evaluate by western blotting analysis (SAL = Salubrinal, 20 αM); tubulin was used as loading control; densitometry values of eIF2α phosphorylation ratio between treated samples and controls are reported (n = 3). (F) Gadd 34 was transient transfected in CHL-1 cells to arrogate the phosphorylation of eIF2α (upper panel), and ecto-CRT was evaluated under DOXO treatment (5 μM, 6 h); (n = 3; * = p < 0,05).
Figure 7. Schematic representation of signaling pathways stimulated by MTX or DOXO in melanoma cells. The pro-ICD drugs MTX and DOXO are able to stimulate the cell death program in melanoma cells (a); concomitantly, both drugs induce an autophagy- (mainly) and caspase- (with less extent) dependent active release of ATP (b), the upregulation of type I IFN genes (c) and a passive release of HMGB1 (d) in the extracellular compartment. The two drugs are also able to stimulate the activation of PKR and GCN2 (e) resulting in eIF2α phosphorylation and mediating the translocation of the ER resident calreticulin (CRT) on to cell surface (f). Interestingly, MTX but not DOXO up-regulates Gadd34 (g) in an ATF4/CHOP-independent manner. This factor, together with PP1, controls the P-eIF2α/eIF2α ratio.