Figures & data
Table 1. Clinical update on the fourteen subjects enrolled in the trial that did not progress during the first two cycle of Imatinib mesylate.
Figure 1. Kaplan-Meier plot of overall and progression-free survival after the first imatinib mesylate of the 24 subjects with relapsed/refractory NB enrolled in the EudraCT: 2005–005778-63 trial.
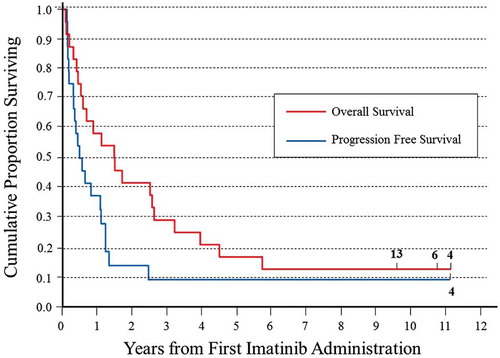
Figure 2. Association between imatinib mesylate exposure and response/outcome. A) Chart of steady state at first cycle of treatment versus response score (CR = 3, PR = 2, SD = 1 and PD = 0). B) Chart of steady state
at second cycle of treatment versus response score. Each subject is indicated by the same symbol in the two graphs. C) Box-plot of
at first cycle in responsive (CR+PR, blue), SD (yellow) and PD (red) subjects. D) Box-plot of
at second cycle in responsive (CR+PR, blue), SD (yellow) and PD (red) subjects. E) Box-plot of
at first cycle in subjects alive (blue) and dead (red) at 24 months after first Imatinib mesylate. F) Box-plot of
at second cycle in subjects alive (blue) and dead (red) at 24 months after first imatinib mesylate.
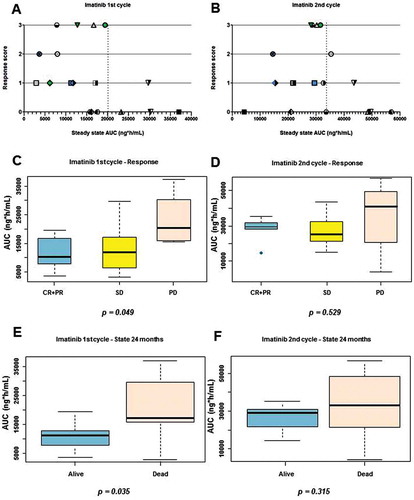
Figure 3. Plasma levels of IFN-γ (A), TNF-α (B), TGF-β (C), IL-10 (D), CXCL12 (E) and sB7-H6 (F) measured in 13 subjects, at study entry (basal) and after 1 or 2 cycles of imatinib mesylate. Each subject is indicated by the same symbol in all graphs.
Figure 4. Expression levels (Log 2-delta Cq) of NKp30 receptor mRNA isoform A (A, B), isoform B (C, D) and isoform C (E, F) evaluated in PB samples (A, C, E) and BM samples (B, D, F), at study entry (basal) and after 2 cycles of Imatinib mesylate in 7 subjects. Each subject is indicated by the same symbol in all graphs.
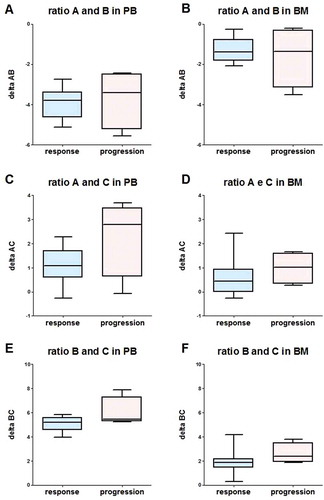
Figure 5. Box-plot of NKp30 ∆AB (A, B), ∆AC (C, D) and ∆BC (E, F), evaluated in PB samples (A, C, E) and BM samples (B, D, F) in responsive (CR+ PR, response, blue) and no responsive (SD + PD, progression, red) subjects, using data measured after 2 cycles of Imatinib mesylate. ∆ was calculated according to the formula ∆NKp30x NKp30y = CqNKp30y – CqNKp30x.