Figures & data
Figure 1. ASTX660 enhances MOC cell death with death ligands. (A) MOC1, MOC2, and MOC22 cells were treated with ASTX660 (1µM), TNFα (20 ng/mL), or the combination, then assessed following 72 hours by XTT assay. (B) MOC1 cells were treated with ASTX660 (1 µM), death ligands TNFα, TRAIL, or FasL (20 ng/mL each), or CDDP (200 ng/mL) alone or in combination. Data are mean + SEM, * p < 0.05.
Figure 2. ASTX660 with cisplatin (CDDP) and PD-1 blockade provides moderately delayed tumor growth and extended survival. (A) 5 × 10⁶ MOC1 cells were implanted into the right flank of wildtype female C57BL/6 mice. Mice were randomized into 5 groups (vehicle control, daily ASTX660, ASTX660 with weekly cisplatin, ASTX660 with anti-PD-1 antibody twice weekly, or the triple combination) of 9 mice each starting 12 days after tumor. ASTX660 treatment began on day 12 with daily treatments via oral gavage for two full weeks with one week off in between (orange arrows). Cisplatin was given once weekly and followed with two days of saline supplementation (brown arrows). Anti-PD-1 antibody was given twice weekly (green arrows). A more detailed treatment schema is available in Supplementary Figure S3A. Error bars represent standard error of the mean. *p < 0.05 versus control. (B) Kaplan-Meier survival curves representing each treatment group. Median survival: 41 days (control), 44 days (ASTX660, p = 0.06), 68 days (ASTX660+CDDP, p = 0.002), 50 (ASTX660+Anti-PD-1, p = 0.03), 65 (ASTX660+CDDP+Anti-PD-1, p = 0.002).
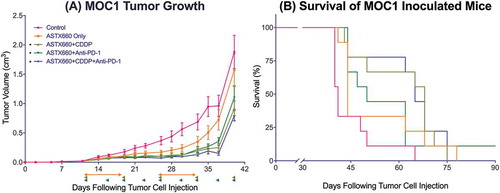
Figure 3. ASTX660 with cisplatin (CDDP) and PD-1 blockade stimulate increased PD-L1 expression and CD8 + T cell tumor infiltration. Tumors were harvested 7 days after starting treatment and analyzed by flow cytometry. MFI, mean fluorescence intensity. *p < 0.05.
Figure 4. ASTX660 combined with XRT and PD-1 blockade significantly delays or prevents tumor growth. (A) 5 × 10⁶ MOC1 cells were implanted into the right hind leg of wildtype female C57BL/6 mice. Mice were randomized into 5 groups (vehicle control, daily ASTX660, 2 doses of XRT, ASTX660+XRT, or ASTX660+XRT with anti-PD-1 antibody twice weekly) of 11 mice each starting 12 days after tumor inoculation. ASTX660 treatment began on day 12 with daily treatments via oral gavage for two full weeks with one week off in between (orange arrows). XRT was given in two doses of 8 Gy each on days 2 and 4 of treatment (brown arrows). Anti-PD-1 antibody was given twice weekly (blue arrows). A more detailed treatment schema is available in Supplementary Figure S3B. Error bars represent standard error of the mean. **p < 0.01 versus control, #p < 0.01 versus ASTX660 or XRT only, + p < 0.05 versus ASTX660+XRT without anti-PD-1. (B) Kaplan-Meier survival curves representing each treatment group.
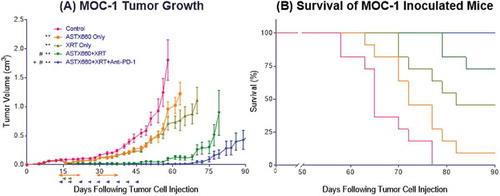
Figure 5. ASTX660 combined with XRT increases CD8 + T cells and dendritic cells within the spleen and activity of T cells from DLNs. (A-E) Immune cells were collected from mouse spleens 4 days after starting treatment and analyzed by flow cytometry. MFI, mean fluorescence intensity. (F) T cells sorted from harvested DLNs were plated (1 × 10⁵ cells per well) with CD3/CD28 Dynabeads for 48 hours before supernatants were collected and analyzed by ELISA for IFNγ production. *p < 0.05.
Figure 6. ASTX660 stimulates cytotoxic T lymphocyte killing. (A) MOC1ova cells were plated with ASTX660 (250 nM) and allowed to grow for 20 hours before addition of effector cells at indicated effector:target (E:T) ratios. (B-C) At both 1:1 and 10:1 E:T ratios, Concanamycin A (ConA, 100 nM), anti-TNFα (20 ng/mL), anti-TRAIL (20 ng/mL), and anti-FasL (20 ng/mL) were also added in addition to CTLs after 20 hours of cell growth. Impedance lines are graphed as averages of 3 replicates that have been normalized to a cell index of 1.0 at 20 hours when drugs or CTLs were added.
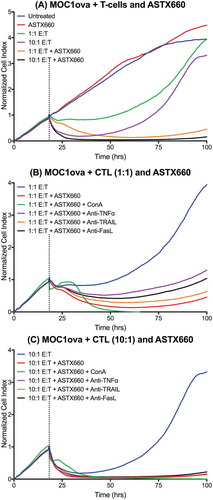
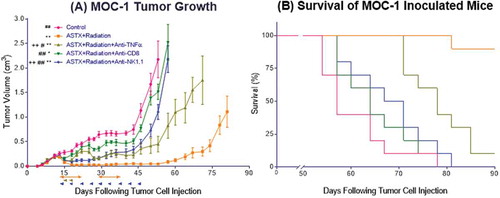
Figure 7. The anti-tumor response to ASTX660+XRT is predominantly driven by CD8 + T cells and, to a lesser degree, NK cells. (A) 5 × 10⁶ MOC1 cells were implanted into the right hind leg of wildtype female C57BL/6 mice. Mice were randomized into 5 groups (vehicle control, daily ASTX660 with 2 doses of XRT, ASTX660+XRT with anti-TNFα twice weekly, ASTX660+XRT with anti-CD8 twice weekly, or ASTX660+XRT with anti-NK1.1 twice weekly) of 10 mice each starting 12 days after tumor inoculation. ASTX660 treatment began on day 12 with daily treatments via oral gavage for two full weeks with one week off in between (orange arrows). XRT was given in two doses of 8 Gy each on days 2 and 4 of treatment (brown arrows). Blocking antibodies were given twice weekly (blue arrows). A more detailed treatment schema is available in Supplementary Figure S3C. Error bars represent standard error of the mean. *p < 0.05, **p < 0.01 versus control, #p < 0.05, ##p < 0.01 versus ASTX660+XRT, ++p < 0.01 vs. ASTX660+XRT+Anti-CD8. (B) Kaplan-Meier survival curves representing each treatment group.