Figures & data
Figure 1. Schematic overview of the clinical trial. Scheme of clinical trial. Patients were included if they had partial response or stable disease after pemetrexed-based chemotherapy. Five patients underwent additional P/D 7–15 weeks after chemotherapy. DC/mCTX therapy started 10–17 weeks after either the last chemotherapeutic treatment or P/D. Blood samples were obtained at t = 0 (baseline); t = 2 (mCTX); t = 4; t = 6; t = 8 (2 wk after DC/mCTX therapy); t = 18.
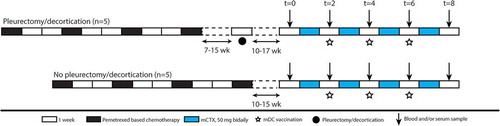
Figure 2. Both aTregs and nTregs, and other naïve cell subsets decreased upon mCTX administration, meanwhile the percentages of proliferating T cells increased. To determine the effect of mCTX administration on activated and naïve Tregs, and other T cell populations, flowcytometric analysis was performed on PBMCs obtained at t = 0 and t = 2, and thereby comparing baseline proportions with the proportions after mCTX administration. To determine IFN·-production, T cells were stimulated 4hrs with PMA/ionomycin in the presence of monensin. A. The proportion of CD3 T cells decreased (41.14%±5.80 to 27.5%±5.0) significantly upon mCTX treatment, as did CD4 T cells (40.99%±6.81 to 21.28%±4.08). The percentage of CD8 T cells increased (54.73%±6.91 to 74.88%±4.28) significantly. B. Both percentages of naïve and activated Tregs decreased significantly from 1.97%±0.40 to 0.86%±0.17, and from 3.23%±0.87 to 1.52%±0.36 respectively. C. The percentages of naïve (28.12%±6.43 to 7.39%±2.21), CM (15.27%±2.41 to 7.74%±2.35) and activated (6.60%±1.58 to 3.64%±0.73) CD4 T cells decreased significantly, while the percentages of EM (38.25%±5.40 to 56.39%±4.85) and TEMRA (6.38%±0.85 to 21.89%±3.91) CD4 T cells increased significantly upon mCTX treatment. D. The percentages of naïve (12.49%±4.41 to 2.62%±1.87) and CM (1.73%±0.57 to 0.35%±0.13) CD8 T cells decreased significantly, while the percentages of TEMRA (57.6%±5.94 to 71.84%±5.67) CD8 T cells increased significantly upon mCTX treatment. The percentage of EM CD8 T cells did not change (28.19%±3.83 vs 25.19%±5.43). E. Upon treatment with mCTX the percentages of proliferating CD4 T cells increased in the naïve (1.50%±0.34 to 14.4%±4.58), CM (4.12%±0.67 to 11.76%±2.61), EM (7.21%±1.14 to 16.22%±4.63) and activated (11.12%±1.15 to 22.99%±3.17) CD4 T cells subset, but not in the TEMRA (10.23%±3.75 vs 25.22%±6.37) subset. The percentage of proliferating nTregs increased (5.89%±1.48 to 37.80%±9.27), but not of aTregs (33.74%±3.11 vs 46.3%±9.77). In CD8 T cells, the naïve (2.13%±1.15 to 10.07%±2.16), EM (5.71%±1.30 to 13.51%±2.95) and TEMRA (3.28%±0.76 to 12.82%±3.42) cells had increased proliferatioin, but not the CM (4.23%±0.88 vs 11.71%±4.11) subset. F. CTLA4 expression in nTegs and aTregs. The dashed line represents the MFI (mean fluorescence intensity) of CTLA4 in a healthy individual. The MFI of CTLA4 increased significantly in nTregs and decreased significantly in aTregs upon treatment with mCTX. G. The proportions of IFN·-producing CD4 (16.99%±3.83 vs 40.15%±7.05) and CD8 (41.17%±6.77 vs 63.57%±6.04) T cells did not change significantly, neither did the percentage of GrB+ CD4 (11.26%±3.55 vs 34.61%±8.17) and CD8 (45.33%±7.25 vs 69.24%±10.01) T cells. Results represent mean ± Standard Error of the Mean (SEM). *p < 0.05, **p > 0.01 (Wilcoxon matched-pairs signed rank test), differences were considered significant when p < 0.05.
Figure 3. After completion of DC/mCTX-based immunotherapy, all Treg and other T cell populations were returned to baseline levels, the percentage of proliferating CM CD8 T was increased compared to baseline. To determine the effects of DC/mCTX-based immunotherapy, flowcytometric analysis of PBMCs obtained at t = 0 (baseline) and t = 8 (after completing DC/mCTX-based immunotherapy) were compared. To determine IFN·-production, T cells were stimulated 4hrs with PMA/ionomycin in the presence of monensin. A. The proportion of CD3 (41.14%±5.80 vs 39.24%±5.332), CD4 (40.99%±6.81 vs 34.23%±5.38) and CD8 (54.73%±6.91 vs 60.82%±5.67) T cells after DC/mCTX-based immunotherapy were comparable to baseline. B. The percentages of nTregs (1.97%±0.40 vs 1.60%±0.32) and aTregs (3.23%±0.87 vs 3.92%±0.89) did not change significantly. C. The percentages of naïve (28.12%±6.43 vs 20.24%±4.34), CM (15.27%±2.41 vs 13.97%±1.80), EM (38.25%±5.40 vs 45.68%±4010), TEMRA (6.38%±0.85 vs 8.82%±1.53) and activated (6.60%±1.58 vs 5.78%±1.21) CD4 T cells did not change significantly D. Neither did the different subsets in CD8 T cells; naïve (12.49%±4.41 vs 8.19%±3.17), CM (1.73%±0.57 vs 1.29%±0.44), EM (28.19%±3.83 vs 31.42%±4.55) and TEMRA (57.6%±5.94 to 59.12%±5.93). E. Upon treatment with DC/mCTX-based immunotherapy the percentages of proliferating CD4 T cells did not change in the different subsets; naïve (1.50%±0.34 vs 1.73%±0.48), CM (4.12%±0.67 vs 4.77%±0.58), EM (7.21%±1.14 vs 9.21%±1.39), TEMRA (10.23%±3.75 vs 9.75%±3.06) and activated (11.12%±1.15 vs 12.69%±1.30). Neither did the proportion of proliferating nTregs (5.89%±1.48 vs 7.54%±2.04) and aTregs (33.74%±3.11 vs 35.9%±2.55). In CD8 T cells the proportion of proliferating cells was higher in the CM (4.23%±0.88 vs 7.19%±1.50) subset and there was a trend towards more proliferating TEMRA (3.28%±0.76 to 4.98%±1.29). In the naïve (2.13%±1.15 to 3.07%±1.35) and EM (5.71%±1.30 to 6.93%±1.96) subset the proportion of proliferating cells was equal before and after DC/mCTX-based immunotherapy. F. The proportions of IFN·-producing CD4 (16.99%±3.83 vs 15.69%±3.17) and CD8 (41.17%±6.77 vs 34.39%±7.67) T cells did not change significantly, neither did the percentage of GrB+ CD4 (11.26%±3.55 vs 17.41%±6.37) and CD8 (45.33%±7.25 vs 49.31%±10.11) T cells. Results represent mean ± Standard Error of the Mean (SEM). *p < 0.05 (Wilcoxon matched-pairs signed rank test), differences were considered significant when p < 0.05.
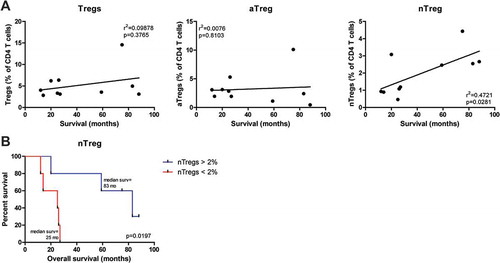
Figure 4. Pretreatment frequencies of nTregs correlated with overall survival in mesothelioma patients treated with DC/mCTX-based immunotherapy. A. To determine whether pretreatment frequencies of total Tregs (the percentage of nTregs and aTregs of total CD4 T cells), aTregs or nTregscorrelated with survival in mesothelioma patients treated with DC/mCTX-based immunotherapy, linear regression was performed. No significant correlation was observed between total Tregs (A, left) or aTregs (A, middle) and survival. Linear regression showed a significant positive correlation between pretreatment nTreg frequencies and survival (A, left). B. To determine whether patients with lower pretreatment nTreg frequencies (below 2% of total CD4 T cells, n = 5) had a different survival from patients with higher nTreg frequencies (above 2% of total CD4 T cells, n = 5), survival analysis was performed. Patients with a nTreg percentage above 2% of CD4 T cells, had a better overall survival. Statistical analysis was performed by log-rank (Mantel-Cox) testing, and differences were considered significant when p < 0.05.