Figures & data
Figure 1. Live T cells are inefficient at reducing sphere forming capacity of BTICs in contrast to their conditioned media. (a) T cells were purified from mouse spleen and activated (ACT) with anti-CD3 and anti-CD28 antibodies, or were left non-activated (NAT) for 2 days. The conditioned medium (CM) and live cells were collected and exposed to syngeneic mouse BTICs. The resultant number of spheres above the 60 µm diameter cutoff was monitored after 3 days by photographing multiple fields per well with subsequent analyses. (b) Outcome images of spheres from mBT0309 co-cultured with T cells at ratio 1:1. (c) Increasing numbers of T cells in co-culture with two mouse BTIC lines were unable to reduce the sphere forming capacity of BTICs. (d) In contrast to live T cells, their CM reduced the sphere forming capacity of mBT0309. (e) T cell CM reduced the number of spheres and the total number of cells. (f) CM were taken after 48 h from ACT and NAT in the presence or absence of mouse BT0309 at ratio 10:1 (T cell:BTIC) to determine the concentration of TNF-α and IFN-γ. (g) T cells were isolated from normal individuals and activated (ACT) with anti-CD3 and anti-CD28 antibodies or were left non-activated (NAT) for 2 days. Cells and CM were collected and co-incubated with human BTIC lines for 3 days. (h) Images of 72h outcomes of spheres from BT025 co-cultured with T cells at ratio 1:1. (i) Activated T cells were inefficient to reduce sphere forming capacity of BTICs. (j) Images of spheres from BT025 co-incubated with T cell CM. (k, l) Conditioned medium from activated T cells significantly reduced the number of spheres and the total number of cells compared to non-activated T cell CM. All bars are mean ± SEM of triplicate cultures. Data in all panels are analyzed by 1-way ANOVA with Tukey’s multiple comparisons post-hoc test. *P < 0.05, **P < 10–2, ****P < 10–4 compared to ACT group unless otherwise displayed. BTIC, Brain tumor initiating cell; ACT, activated T cell; NAT, non-activated T cell; CM, Conditioned medium. Scale bar, 60 μm.
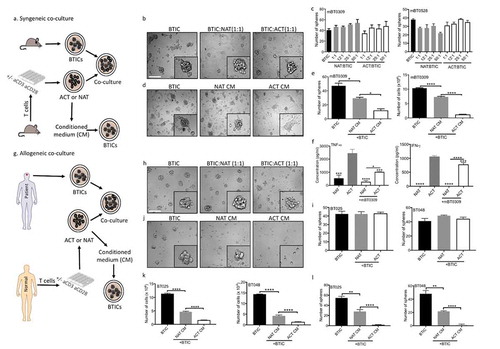
Figure 2. BTIC conditioned medium inhibits proliferation and effector functions of T cells.
(a) Conditioned medium (CM) from two human BTIC lines reduced human T cell proliferation while CM from human neurons, as non-transformed cells, did not inhibit T cell proliferation as determined by ATP Luminescence assay. (b, c) The expression of CD69, an early T cell activation marker, was significantly reduced following exposure to BTIC CM (b: Representative flow plots of CD69 expression). (d-g) Percentage of cells expressing both IFN-γ and IL-2 was significantly lowered after exposing T cells to BTIC CM (f, g: Representative flow plots). (h, i) T cells incubated with BTIC CM decreased their level of signaling molecules compared to activated T cells as determined by flow cytometry (h: Representative flow plots). All bars are mean ± SEM of triplicate cultures. Data in all panels are analyzed by 1-way ANOVA with Tukey’s multiple comparisons post-hoc test. *P < 0.05, ***P < 10–3, ****P < 10–4 compared to ACT group. BTIC, Brain tumor initiating cell; ACT, activated T cell; NAT, non-activated T cell; CM, Conditioned medium; MFI, Mean fluorescence Intensity.
Figure 3. TNC produced by BTICs is in proximity to T cells in the brain tumor microenvironment; in culture TNC inhibits T cell responses. (a, b) Immunoblots of lysates prepared from human and mouse BTIC lines show TNC expression; neuronal lysate is included as a non-transformed control comparison. Moreover, TNC is present in the conditioned medium (CM) of human and mouse BTIC lines. (c) Flow cytometry analysis show surface expression of TNC on human and mouse BTIC lines. (d) Representative image from immunofluorescence staining shows the high level of expression of TNC in the glioblastoma microenvironment, in proximity to CD3-positive T cells in a tumor area with high T cell infiltration. (e) Purified TNC significantly reduced T cell proliferation as determined by ATP Luminescence assay. (f, g) Activated T cells show a decreased level of CD69 expression following exposure to TNC. (h-k) T cells exposed to TNC significantly lowered their expression of IFN-γ and IL-2 compared to activated T cells. (l) Following shRNA transduction, Western blot analysis confirmed the reduction of TNC in two human BTIC lines. (m) CM from TNC knock-down BTICs inhibited T cell proliferation to a significantly lesser extent than control shRNA. (n) Silencing of TNC in BTICs results in the enhanced cytotoxic ability of T cells as shown by increased number of dead BTICs compared to control shRNA. All bars are mean ± SEM of triplicate cultures. Data in all panels are analyzed by 1-way ANOVA with Tukey’s multiple comparisons post-hoc test. *P < 0.05, **P < 10–2, ***P < 10–3, ****P < 10–4 compared to ACT group (p values in panel m and n are relative to control shRNA unless otherwise displayed). BTIC, Brain tumor initiating cell; ACT, activated T cell; NAT, non-activated T cell; CM, Conditioned medium; MFI, Mean flourescence Intensity. Scale bar, 50 μm.
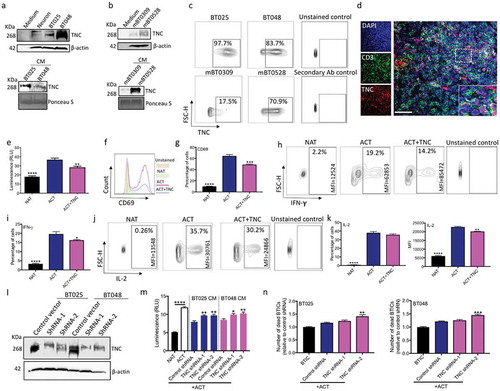
Figure 4. TNC inhibits T cell functions through integrin α5β1 and αvβ6. (a) Live/dead cell FACS analysis shows that TNC is not toxic to activated T cells after 2 days incubation. (b) Huaman T cells were activated with anti-CD3 and anti-CD28 antibodies in the presence of exogenous TNC and blocking antibodies to α2β1, α5β1, α9β1 and αvβ6 integrin receptor. Blocking antibodies to α5β1and αvβ6 abrogated the suppressive activity of TNC on T cell proliferation. (c) Combination of blocking antibodies to α5β1 and αvβ6 had a greater effect on the reversion of T cell proliferation that either antibody alone. (d) Activated T cells express α5β1and αvβ6 receptor as documented by flow cytometry analysis. (e, f) Purified TNC reduced the expression of p-Akt (MFI) and p-mTOR (% cells and MFI). (g) Down-regulation of p-mTOR and total mTOR in T cells after treatment with BT025 CM and TNC. (h) Blocking both α5β1and αvβ6 receptors following treatment with TNC elevated p-mTOR expression in T cells.
All bars are mean ± SEM of triplicate cultures. Data in all panels are analyzed by 1-way ANOVA with Tukey’s multiple comparisons post-hoc test. *P < 0.05, **P < 10–2, ***P < 10–3, ****P < 10–4 compared to ACT group (p values in panel b, c and h are relative to ACT+TNC group unless otherwise displayed). ACT, activated T cell; NAT, non-activated T cell.
Figure 5. TNC expression in glioblastoma is associated with an aggressive and immuno-suppressive tumor phenotype. (a) TNC mRNA expression plotted based on increasing median expression across 20 major solid tumor types in TCGA. (b) TNC mRNA expression in TCGA patients belonging to four glioblastoma subtypes. (c) Spearman correlation matrix of TNC expression with interleukin 2 (IL2), interferon-γ (IFNG), interleukin 17A (IL17A), tumor growth factor β (TGFB1), intra-tumoral cytolytic activity (GZMB expression), tumour infiltrating CD8+ T cells (expression of CD3E and CD8A) and regulatory T cells (expression of CD3E, FOXP3 and IL2RA). The colors denote positive (increasing intensity of red) and negative (increasing intensity of blue) correlation. (d) Kaplan-Meier curves showing the association between TNC mRNA expression (green: above median; red: below median) and overall survival in TCGA glioblastoma patients.
STAD, stomach adenocarcinoma; LIHC, Liver hepatocellular carcinoma; BLCA, bladder cancer; COAD, colorectal adenocarcinoma; PAAD, pancreatic adenocarcinoma; UCEC, uterine corpus endometrial carcinoma; THCA, thyroid cancer; KIRC, clear cell renal cell carcinoma; PRAD, prostate adenocarcinoma; KIRP, Kidney Renal Papillary Cell Carcinoma; CESC, cervical squamous cell carcinoma; LGG, low-grade glioma; BRCA, breast cancer; LUAD, lung adenocarcinoma; ESCC, esophageal squamous cell carcinoma; LUSC, lung squamous cell carcinoma; SKCM, skin cutaneous melanoma; SARC, sarcoma; GBM, glioblastoma multiforme; HNSC, head and neck squamous cell carcinoma.
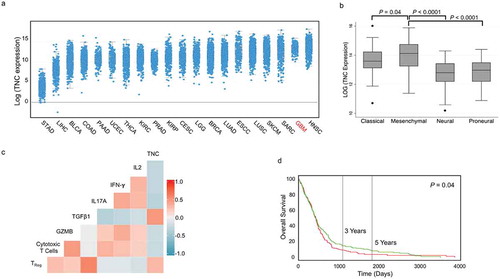
Figure 6. BTICs export TNC through exosomes. (a) Representative TEM image of exosomes derived from BT012. (b) The expression of the exosome markers TSG101 and Flotillin 1 was verified by Western blot. (c) Moreover, CD63, an exosome surface antigen, was detected by flow cytometry of isolated vesicles. (d, e) TNC was detected in exosomes from two human and two mouse BTIC lines. Upon centrifugation to deplete (dep.) exosomes, the CM of BTICs no longer exhibited TNC expression. (f) Exosomes were isolated from BTIC conditioned media by Size Exclusion Chromatography (SEC) followed by ultracentrifugation. The expression of TNC, exosome marker Flotillin 1, cis-Golgi marker GM130 and endoplasmic reticulum marker Calnexin was determined by Western blot. (g) Exosome particles expressed TNC on their surface as documented by flow cytometry analysis. (h) Exosomes isolated from BTICs contain a higher amount of TNC than exosomes derived from neurons. (i) Western blot analysis of TNC expression in isolated exosomes from the blood of three glioblastoma patients and two control individuals. (j) Densitometric analysis of blot normalized to Ponceau S staining shows that circulating exosomes in the blood of three glioblastoma patients contained significantly more TNC than those from control individuals. Data in panel j are analysed by unpaired t-test (2-tailed). **P < 10–2.
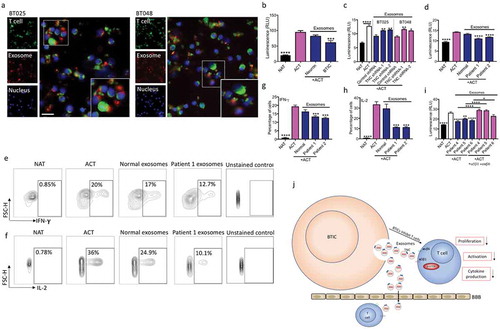
Figure 7. Exosomes from BTICs exert their inhibitory effects on T cells through TNC expression. (a) Exosomes isolated from human BTIC lines were labeled red with BODIPY TR Ceramide. T cells were purified from healthy individual and stained green with DiO. Representative images show exosome association with T cells. (b) In contrast to exosomes from neurons, BTIC exosomes suppressed T cell proliferation. (c) TNC-depleted exosomes had lower inhibitory effects on T cell proliferation compared to control shRNA exosomes. (d) Circulating exosomes from two glioblastoma patients induced a higher reduction in T cell proliferation than healthy control exosomes. (e-h) Exosomes from glioblastoma patients caused greater reduction of IFN-γ and IL-2 levels in activated T cells than normal exosomes (e, f: Representative flow plots). (i) Blocking both α5β1and αvβ6 receptors following treatment with plasma exosomes from three glioblastoma patients elevated T cell proliferation. (j) The postulated mechanism of T cell suppression by TNC expressed on exosomes. The cartoon depicts that BTICs release exosomes that carry TNC. TNC through interaction with integrin receptors α5β1 and αvβ6 attenuates the expression of p-mTOR in T cells. This results in the reduction of T cell proliferation, activation and cytokine production. Moreover, exosomes pass through the BBB in glioblastoma patients to alter systemic immunity. All bars are mean ± SEM of triplicate cultures. Data in all panels are analyzed by 1-way ANOVA with Tukey’s multiple comparisons post-hoc test. *P < 0.05, **P < 10–2, ***P < 10–3, ****P < 10–4 compared to ACT group unless otherwise displayed (p values in panel c are relative to control shRNA unless otherwise displayed). BTIC, Brain tumor initiating cell; ACT, activated T cell; NAT, non-activated T cell. Scale bar, 20 μm.