Figures & data
Figure 1. SGT-53 increases immunogenicity and induces ICD. (A) 4T1 cells were treated with either SGT-53 or scL-vec nanocomplex. Expression of human p53 was assessed by quantitative RT-PCR. The fold-change relative to mouse GAPDH mRNA is shown on a log scale (n = 6). (B) Expression of mouse genes associated with immune responses was assessed by RT-PCR in the cells treated with SGT-53 (n = 6). (C) Release of HMGB1 and ATP was assessed in the culture media (n = 6). (D) Induction of apoptosis was assessed via Annexin V/7-AAD staining at 48 h after transfection. Numbers in the quadrants indicate the percentage of cells in that quadrant. (E) Expression of cell surface components of immunogenicity was assayed at 48 h after transfection via FACS (n = 4). Data are shown as mean ± SEM. *p < 0.001, **p < 0.05, 1-way ANOVA with Bonferroni t-test.
Figure 2. SGT-53 increases immunogenicity of tumor in vivo. Mice bearing established 4T1 tumor were i.v. treated with SGT-53 (30 µg DNA/mouse). Expression of cell surface components of immunogenicity was assayed 48 h later via FACS and compared with those in tumor from untreated mice (n = 4). Tumor cells were dissociated by enzymatic digestion and identified by gating CD45−CD31− live cells. Data are shown as mean ± SEM. *p < 0.001, **p < 0.05, Student’s t test.
Figure 3. Enhanced tumor growth inhibition by the combination of anti-PD1 and SGT-53. BALB/c mice with s.c. 4T1 tumor were randomized to therapy with anti-PD1, either alone or in combination with SGT-53 (n = 10). (A) Treatment schedule. Mice received total 5 injections of SGT-53 and/or 5 injections of anti-PD1. (B) Changes in tumor sizes were plotted versus the number of days after initiation of the treatment. (C) Quantification of tumor weight at harvest on day 17. For group treated with anti-PD1, tumors were harvested on day 16 or 17 when the mice were moribund. *p < 0.05, **p < 0.001, 1-way ANOVA with Bonferroni t-test. (D) Changes in body weight are shown. Data are shown as mean ± SEM.
Figure 4. Enhanced tumor growth inhibition by anti-PD1 plus SGT-53 combination in mouse syngeneic tumor models. C57BL/6 mice with s.c. LL2 tumors (A) or GL261 tumors (B) were randomized to therapy with anti-PD1 (200 µg antibody/mouse/injection, i.p.), either alone or in combination with SGT-53 (30 µg DNA/mouse/injection, i.v.) (n = 6–10). Tumor sizes were plotted versus the number of days after initiation of the treatment. Data are shown as mean ± SEM.
Figure 5. SGT-53 increases apoptosis and inhibits proliferation of 4T1 tumor in vivo. IHC staining of tumors treated as shown in . Representative IHC staining (A) and quantification (B) of Casp3, TUNEL, and Ki-67 are shown. Scale bar, 50 µm. At least five fields of view from three tumor sections were counted using the ImmunoRatio, an automated cell counting software (http://153.1.200.58:8080/immunoratio/). Data are shown as mean ± SEM. *p < 0.05, 1-way ANOVA with Bonferroni t-test.
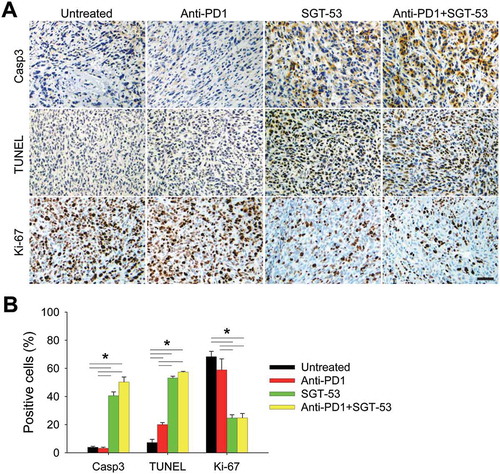
Figure 6. SGT-53 substantially reduces lung metastases of 4T1 tumors. Lung tissues were harvested from tumor-bearing BALB/c mice treated as shown in . (A) Representative images of H&E stain of lung. T, tumor. Scale bar, 100 µm. (B) Metastatic lung nodules were microscopically counted per 4× field of view and plotted. At least five fields of view from three tissue sections were counted and averaged. Data are shown as mean ± SEM. *p < 0.001, 1-way ANOVA with Bonferroni t-test.
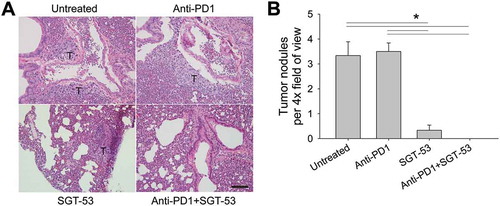
Figure 7. SGT-53 enhances immune responses in 4T1 tumor in vivo. Tumor cells were dissociated and immune cell infiltration was assessed via FACS. (A) Infiltrating immune cells were identified by gating CD45+ live cells including DCs (CD11c+I-A/I-E+), macrophages (CD11b+F4/80+), activated CD4 TILs (CD3+CD4+CD107a+), and activated CD8 TILs (CD3+CD8+CD107a+). Infiltrating cells are shown in terms of absolute number of cells per 1 × 10⁴ live cells collected (n = 6–8). (B) Representative FACS plots (left panels) and graphs (right panels) of CTLs (CD3+CD8+GzmB+ or CD3+CD8+IFNγ+) are shown. Numbers in the plots indicate the percentage of cells (n = 6–8). (C) Immunosuppressive MDSCs (CD11b+Gr1+) and Tregs (CD3+CD4+FoxP3+) were identified (n = 6–8). (D) Altered expression of genes associated with immunosuppression in the tumor tissue were assessed via NanoString. (E) Expression of genes associated with immunosuppressive enzymes was assessed by RT-PCR in the tumors (n = 6–8). The fold-change relative to untreated tumors is shown. Data are shown as mean ± SEM. *p < 0.05, 1-way ANOVA with Bonferroni t-test.
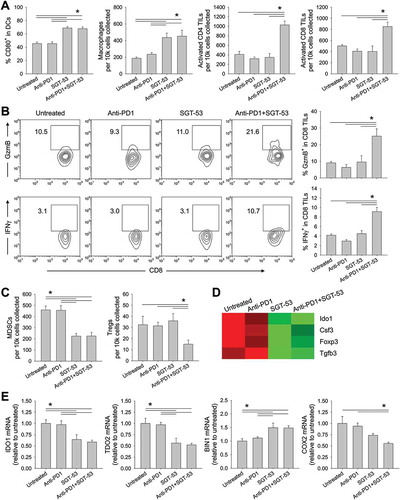
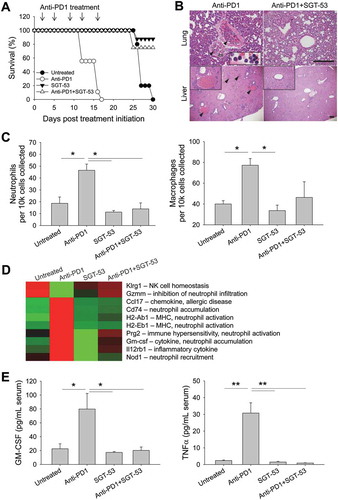
Figure 8. SGT-53 prevents fatal xenogeneic hypersensitivity following repeated anti-PD1 administration in a syngeneic 4T1 breast cancer model. (A) Survival of BALB/c mice bearing 4T1 tumor after repeated dosing with anti-PD1 antibody alone or in combination with SGT-53. Mice received total five injections of SGT-53 and/or five injections of anti-PD1 following the treatment schedule shown in . Arrows indicate the anti-PD1 injection. (B) Representative H&E stains of lungs and livers of mice treated with either anti-PD1 alone or in combination with SGT-53. Arrowheads indicate neutrophilic accumulation. Scale bars, 200 µm. (C) Infiltrating neutrophils (CD11b+F4/80−Gr1hi) and macrophages (CD11b+F4/80+) were assayed in the lung via FACS (n = 4). Infiltrating cells are shown in absolute number of cells per 1 × 10⁴ live cells collected. (D) Heatmap of significantly altered gene expression in tumor tissue from mice treated with anti-PD1 antibody that were reversed in tumor tissue from mice treated with anti-PD1 plus SGT-53. (E) Sera from tumor bearing mice receiving the indicated treatment were collected and analyzed for levels of mouse GM-CSF or TNFα using ELISA (n = 8). Data are shown as mean ± SEM. *p < 0.05, **p < 0.001, 1-way ANOVA with Bonferroni t-test.