Figures & data
Figure 1. MUC16 frequently mutates in endometrial cancer.
Exome sequencing data of 530 endometrial cancer samples in TCGA-UCEC project were analyzed through the use of mutect2 mutation-detection algorithm.(A) The number of mutations based on variant type.(B) The number of mutations based on variant classification.(C) The OncoPlot of the top ten mutated genes. The upper barplot indicates the number of genetic mutations per patient, while the right barplot shows the number of genetic mutations per gene. The mutation types were added as annotations in the bottom. Variants annotated as Multi_Hit are those genes that mutated more than once in the same sample.(D) The number of mutations of MUC16 gene based on single nucleotide variant (SNV) class.(E) The pie chart of mutations of MUC16 gene occurred in indicated exons.(F) The lollipopPlot of MUC16 gene. Amino acid axis labeled for domain. The mutation types were added as annotations in the bottom.(G) The number of mutations for all patients, patients with mutant MUC16 and patients with wild type MUC16. The data are compared by unpaired two-tailed Student’s t-test. The bars represent mean and SEM.
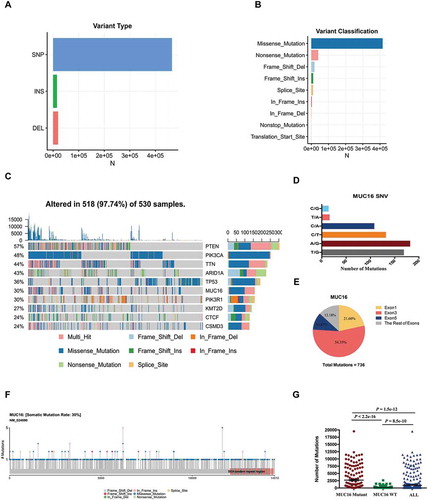
Table 1. Clinical characteristics of patients with endometrial cancer. NA, not available.
Table 2. Univariate and multivariate Cox regression analysis in endometrial cancer patients.
Figure 2. MUC16 mutational status, histologic grade and clinical stage are independent prognostic factors for endometrial cancer patients.
(A) Kaplan-Meier curve and Log-rank test for endometrial cancer patients base on clinical stage classification.(B) Kaplan-Meier curve and Log-rank test for endometrial cancer patients base on histologic grade classification.(C) Kaplan-Meier curve and Log-rank test for endometrial cancer patients base on MUC16 mutational status classification.
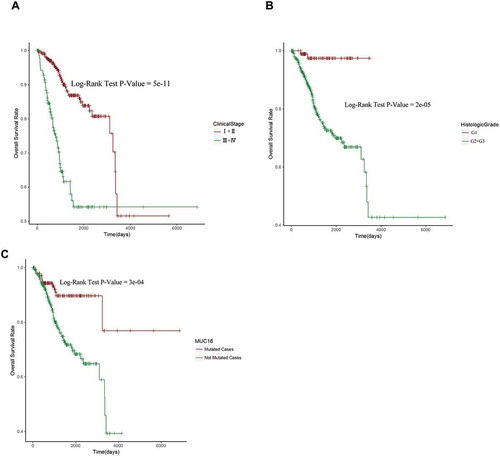
Figure 3. Mutated MUC16 are involved in endometrial cancer patients’ antitumor immune responses.
Gene Set Enrichment Analysis (GSEA) of global gene expression profiling between 158 tumor samples with mutant type MUC16 and 366 tumor samples with wild type MUC16. Gene sets annotated by GO terms were used in the analysis. NES, normalized enrichment score; P = nominal P value; FDR = false discovery rate.Gene sets representing Immune Response (A), Lymphocyte Activation (B), Leukocyte Activation (C), Adaptive Immune Response (D), Chemokine Mediated Signaling Pathway (E) and Cellular Response to IFN-γ (F) were enriched in patients with MUC16 mutations.
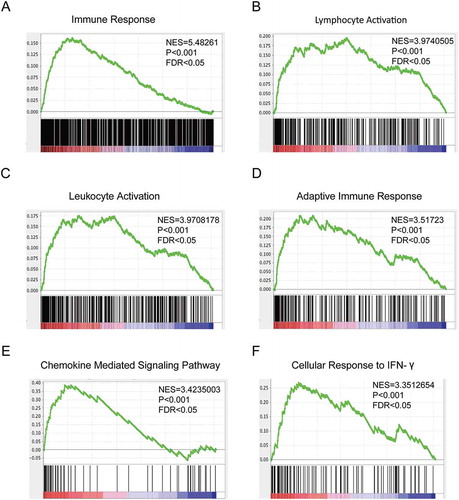
Figure 4. MUC16 mutations are involved in cytotoxic immune cell mediated antitumor responses.
(A)-(C) GSEA using the canonical pathways, which are annotated pathways mainly from BIOCARTA, KEGG and REACTOME databases, as the gene sets in the analysis. NES, normalized enrichment score; P = nominal P value; FDR = false discovery rate.(A) A gen set representing Genes involved in immunoregulatory interactions between a lymphoid and a non-lymphoid cell was enriched in patients with MUC16 mutations.(B) A gen set representing Genes involved in phosphorylation of CD3 and TCR zeta chains was enriched in patients with MUC16 mutations.(C) A gen set representing NO2-dependent IL 12 Pathway in NK cells was enriched in patients with MUC16 mutations.(D) Volcano plot of differentially expressed genes (DEGs) between mutant and wild type MUC16 endometrial cancer samples. Red dot represents up-regulated genes and blue dot represents down-regulated genes.(E) BIOCARTA pathway analysis of DEGs via DAVID database. Blue bars that cross the threshold line (P < 0.05) represent pathways that are significantly changed between mutant and wild type MUC16 endometrial cancer samples.
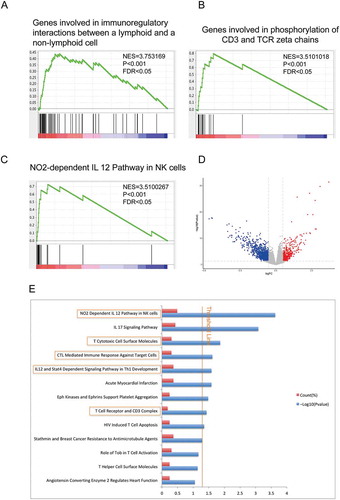
Figure 5. Hierarchical clustering analysis of two pathways, NO2-dependent IL 12 pathway in NK cells and T cytotoxic cell surface molecules.
(A) and (C) Unsupervised hierarchical clustering with Euclidean distance and ward linkage of expression matrixes from 17 genes in NO2-dependent IL 12 pathway in NK cells (A) and 12 genes in T cytotoxic cell surface molecules (C) of 524 samples (158 of which have MUC16 mutational status). Rows indicate the identity of the genes and columns indicate the identity of the patients. The MUC16 mutational status for each tumor is depicted directly above each column. Cluster I exhibits a higher expression of genes in these two pathways, and cluster II exhibits a lower expression level.(B) The Kaplan-Meier curves for the resulting clusters from the unsupervised hierarchical clustering in (A).(D) The Kaplan-Meier curves for the resulting clusters from the unsupervised hierarchical clustering in (C).
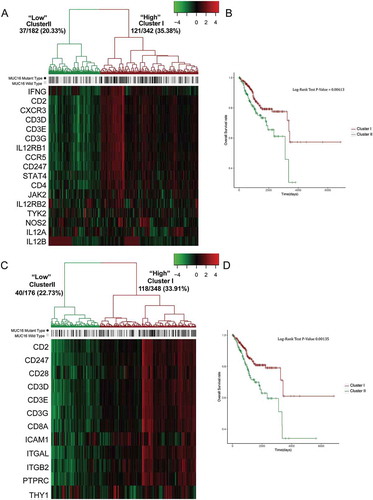
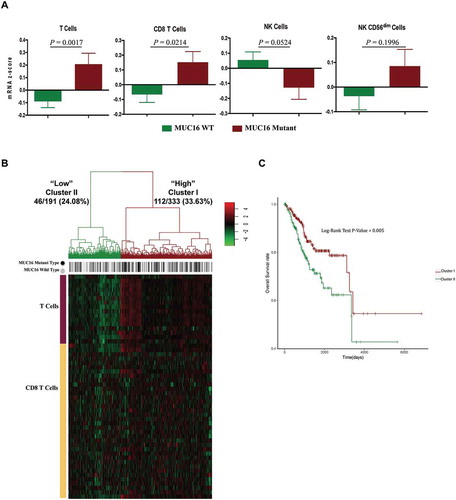
Figure 6. MUC16 mutations enhance the infiltration and antitumor immunity of cytotoxic T lymphocytes in the endometrial cancer microenvironment.
(A) Tumor sample transcriptomic immune profiling between patients with mutant and wild type MUC16. The data are represented as mean± SEM and compared by unpaired two-tailed Student’s t-test.(B) Unsupervised hierarchical clustering with Euclidean distance and ward linkage of expression matrixes from 16 genes in T cell signature and 36 genes in CD8+ T cell signature of 524 samples. Rows indicate the identity of the genes and columns indicate the identity of the patients. The MUC16 mutational status for each tumor is depicted directly above each column. Cluster I exhibits a higher expression of genes in these two signatures, and cluster II exhibits a lower expression level.(C) The Kaplan-Meier curves for the resulting clusters from the unsupervised hierarchical clustering in (B).