Figures & data
Figure 1. Effective Immune checkpoint blockade for mesothelioma.
BALB/c mice bearing AB1 HA tumours were treated with antibodies targeting individual immune checkpoint molecules on days 10, 13 and 16 post tumour inoculation. (A) Experimental design. (B) Survival and (C) tumour growth plots of mice treated with ICPB monotherapies. The horizontal line indicates significant delay in tumour growth over time compared to PBS. (D) Tumour growth curves for individual mice in each group compared to PBS controls. Combined data from two independent experiments analysed using Log rank (Mantel Cox) for survival curves or Mixed model ANOVA for mean tumour growth. * = p < 0.05, *** = p < 0.001, **** = p < 0.0001, ns = not significant.
Figure 2. Effective combination Immune checkpoint blockade for mesothelioma.
BALB/c mice bearing AB1‑HA tumours were treated with antibodies targeting immune checkpoint molecules either alone or in combination on days 10, 13 and 16 post tumour inoculation. (A) Survival and (B) tumour growth plots for mice treated with combination ICPB therapy. Significant differences for groups relative to PBS control unless otherwise shown. Horizontal lines indicates significant delay in tumour growth over time for each group compared to PBS. (C) Tumour growth curves for PBS and combination groups. Each line represents a tumour bearing mouse. Combined data from two independent experiments analysed using Log rank (Mantel-Cox) for survival curves or Mixed model ANOVA for mean tumour growth. * = p < 0.05, *** = p < 0.001, **** = p < 0.0001, ns = not significant.
Figure 3. Combination immune checkpoint blockade is effective in an orthotopic mesothelioma model.
BALB/c mice (n = 5 PBS, n = 10 αCTLA4+ αOX40) were injected intrapleurally with 2 × 10⁵ AB1-HA cells on day 0 and treated with PBS or ICPB on days 6, 8 and 10. (A) Overall survival. (B) Tumour burden (weight of heart + lungs + tumour) for individual mice on the day they were culled. (C) Representative histology (20 x Mag) showing haematoxylin and eosin (H&E) staining of pleural tissues taken from two mice randomly selected from each treatment group (L = lung; H = heart and T = tumour). ICPB (αC+ αO); 100 μg αCLTA-4 + 200 μg αOX40. Data shows mean ± SD. *** p < 0.001. Survival analysis: Log rank (Mantel-Cox). Tumour burden analysis: unpaired t-test (Mann-Whitney).
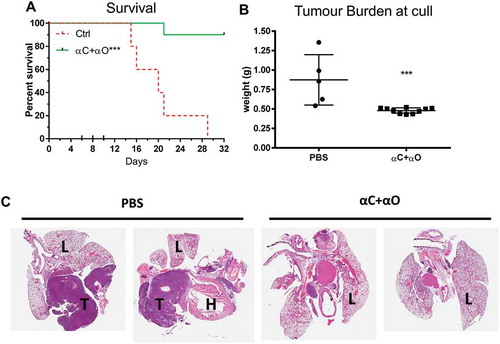
Figure 4. Immune checkpoint therapy is less effective in AB12 and Line-1M.
Tumour bearing BALB/c mice were treated with antibodies targeting selective immune checkpoint molecules either alone, or in combination when tumours were 25 mm2 to 30 mm2 (treatment days indicated by up ticks). Data shows survival and tumour growth plots for mice bearing AB12 (A-B) and Line-1M (D-E) tumours treated with indicated ICPB therapies. Tumour growth curves for individual mice in each group compared to PBS controls for AB12 (C) and Line-1M (F). Each line represents a tumour bearing mouse with significant differences for groups relative to PBS controls shown unless otherwise stated. Horizontal lines indicates significant delay in tumour growth over time for each group compared to PBS. Combined data from two independent experiments analysed using Log rank (Mantel-Cox) for survival curves or Mixed model ANOVA for mean tumour growth. * = p < 0.05, *** = p < 0.001, **** = p < 0.0001, ns = not significant.
Figure 5. AB1-HA, AB12 and Line-1M tumour and dLN lymphocyte expression of ICP receptors.
Flow cytometry was used to assess ICP expression profiles of tumour and draining lymph node resident immune cells harvested from mice bearing small (day 10, ~ 25 mm2) AB1-HA, AB12 or Line-1M tumours. (A) Experimental design. (B) Gating strategy for identification of CD4 (CD3+ CD4+ FoxP3-), Treg (CD4+ CD25+ FoxP3+) and CD8 (CD3+ CD8+) lymphocytes, each of which were further gated in histogram plots depicting MFI expression of CTLA-4, GITR, OX40, PD-1 and TIM-3. (C) Tumour CD3 frequency of total live cells; CD4, Treg and CD8 percentage frequency of CD3 population and frequency of TIL ICP receptor expression for CD4, Treg and CD8 T cells. (D) Tumour dLN CD3 percentage frequency of total live cells, and CD4, Treg and CD8 percentage frequency of CD3 population. Tumour dLN frequency of ICP receptor expression for CD4, Treg and CD8 T cells. CD4 (white), Treg (black) and CD8 (hatched) columns, n = 5–9 mice/group from two independent experiments, data are mean ± SEM; One Way ANOVA *p < 0.05, **p < 0.01 compared to respective AB1-HA population.
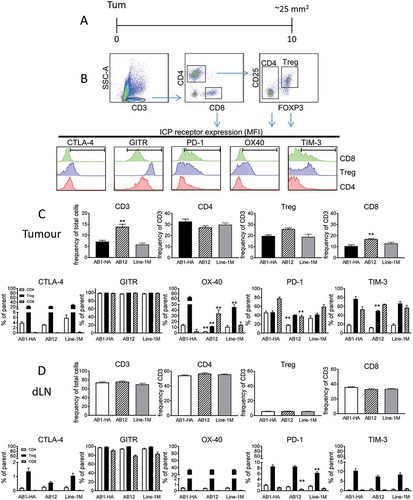
Figure 6. AB1-HA ICPB dual tumour growth.
Mice were s.c. inoculated on right (RHF) and left (LHF) flank with 5 × 10⁵ AB1 HA cells and immune checkpoint immunotherapy administered i.p. on day 10, 13 and 16 (black arrows). Two days post therapy (day 18, dotted line) RHF tumours and their associated draining lymphnode were harvested for analysis. (A) Dual tumour experimental design. (B) Individual tumour growth curves for both RHF (squares, excised day 18) and LHF (circles) tumours. Data shown: n = 10 mice/group from two independent experiments. (C) Immune cell subset phenotype as a frequency of total live tumour and CD3 T cells. (D) CD8 and CD4 effector T cell to Treg cell ratio. (C D) Data are mean ± SEM; All statistics are one way ANOVA with Bonferroni’s test for multiple comparisons; *p < 0.05, **p < 0.01, ***p < 0.001, ****p < 0.0001 relative to control unless otherwise indicated.
Figure 7. Response to ICPB is associated with distinct T cell profile for activation and inhibition markers.
Flow cytometry was used to assess the expression of cell surface markers denoting cellular proliferation (Ki67), activation ICOS and the inhibitory checkpoint molecule PD-1) on (A) tumour (TIL) and (B) tumour draining lymphnode (dLN) resident Treg and CD4 and CD8 effector T cells. Tumours are from mice described in (n = 10 mice/group). Data are mean ± SEM; All statistics are one way ANOVA with Bonferroni’s test for multiple comparisons; *p < 0.05, **p < 0.01, ***p < 0.001, ****p < 0.0001 relative to control unless otherwise indicated.