Figures & data
Figure 1. Oral IL-10 reduces tumor burden in mice with established disease. (A, B) Colon tumor number and maximum diameter. APCmin/+ mice were treated with oral particle-based therapy (either blank particles or particles loaded with recombinant murine IL-10) for 3 weeks beginning 4 weeks after enterotoxic B fragilis inoculation. Mice were then euthanized, and tumor number (A) and maximum tumor diameter (B) in the mouse colon were assessed. Error bars = SD, n = 5 per group. (C, D) Histologic severity of disease. At the time of euthanasia, colons were fixed in 10% neutral buffered formalin, embedded in paraffin, and stained with hematoxylin and eosin as described in Methods and Materials (C). Colons were serially sectioned and degree of dysplasia classified according to the following scale: no dysplasia (0), low grade dysplasia (1), mix of low and high grade dysplasia (2), high grade dysplasia (3) and invasive cancer (4). Examples of no dysplasia (a); low grade dysplasia with pseudo-stratification of the nuclei and nuclear enlargement (b); cribriforming tumor glands significant for high grade dysplasia (c); and surface epithelium with higher grade tumor underneath significant for invasion (d) are shown. Magnification: 20X (D). Error bars = SD. n = 3 per group. Significance: *, **, *** denote p < 0.05, 0.01, 0.001, respectively
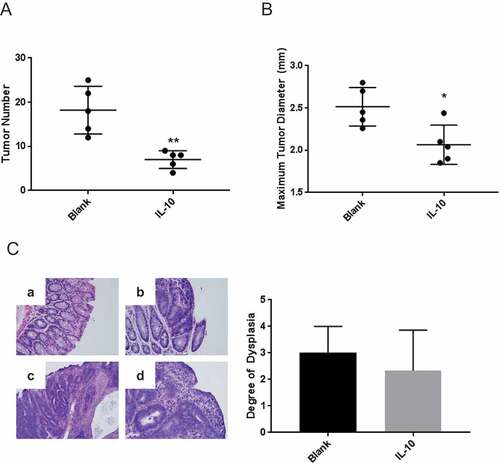
Figure 2. Oral IL-10 and IL-12 act synergistically to eradicate established disease and improve overall survival. (A, B) Colon tumor number and maximum diameter. APCmin/+/B fragilis mice were treated with oral particle-based therapy (blank, IL-10, IL-12, or a mixture of IL-10 and IL-12 particles) as in . Mice were then euthanized, and tumor number (A) and maximum tumor diameter (B) in the mouse colon were assessed. Error bars = SD, n = 7–8 per group. (C) Histologic severity of disease. At the time of euthanasia, colons were fixed and H&E-stained sections were analyzed as in . Error bars = SD, n = 3 per group. (D) Overall survival. APCmin/+/B fragilis mice were treated until euthanasia. n = 12 and 10 for control and experimental groups, respectively. Significance: *, **, *** denote p < 0.05, 0.01, 0.001, respectively
Figure 3. Distinct immunological effects of IL-10 and IL-12 on T-cell subsets are partially responsible for the antitumor synergy. (A) Effect of orally administered IL-10 and IL-12 on Th17 and CD8 + T cells. APCmin/+/B fragilis mice were treated with oral particle-based therapy (blank, IL-10, IL-12, or a mixture of IL-10 and IL-12 particles) as in . Mice were euthanized and lymphocytes were isolated from mesenteric lymph nodes. CD4+ RORγt+ cells were gated on and analyzed for IL-17 production (Th17), and CD8 + T cells were analyzed for IFNγ production (CD8 + T-cells) by FACS. Cell numbers shown are per MLN. For CD8 + T-cell panel: filled-in circles = % of total lymphocytes; box plot = number of CD8+ IFNγ+ cells. Boxes have lines at the median plus lower and upper quartiles, with whiskers extending to show the remaining data. Error bars = SD, n = 5 per group. (B) Effect of CD8 + T cell depletion on tumor burden. Tumor-bearing APCmin/+ mice were treated as in in the absence or presence of anti-CD8α monoclonal antibody administration and assessed for tumor burden. Error bars = SD, n = 5–6 per group. Significance: *, ** denote p < 0.05, 0.01, respectively
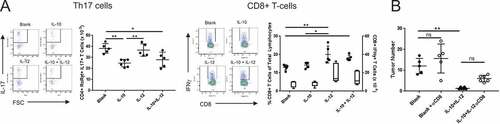
Figure 4. Therapeutic synergy requires IFNγ and is in part associated with the effects of cytokines on gut epithelial barrier integrity. (A) Effect of IFNγ neutralization on therapeutic outcome. Tumor-bearing APCmin/+ mice were treated as in in the absence or presence of anti-IFNγ monoclonal antibody administration and assessed for tumor burden. (B) Gut permeability. Experimental mice were administered FITC-labeled dextran via oral gavage at the end of treatment and sera were analyzed for fluorescence to assess leakage as described in Methods and Materials. (C) Effect of IFNγ neutralization on gut permeability. Mice were treated in the absence or presence of IFNγ-neutralizing antibody and sera were analyzed as above. Naïve APCmin/+ mice served as a control for baseline permeability. Error bars = SD, n = 5–6 per group for all studies. Significance: *, **, *** denote p < 0.05, 0.01, 0.001, respectively
Figure 5. IL-12 induces IFNγ and IL-10RA expression in the colon. (A) Quantitative PCR analysis of IL-10RA and IFNγ mRNA. Quantitative PCR was performed to evaluate relative changes in IL-10RA and IFNγ transcript levels in the colon in blank or cytokine particle-treated mice. (B) IL-10RA expression on colon epithelium. Colon sections from control (blank), IL-10, IL-12 and IL-10+ IL-12-treated mice were stained for DAPI (blue), E-cadherin (green), and IL-10RA (red) and visualized by laser-scanning confocal microscopy. (C) FACS analysis of epithelial cell IL-10RA expression. Single cell preparations from colon epithelia of control and treated mice (along with a negative control, i.e. IL-10RA knockout wild-type B6 mice) were stained for EpCAM and IL-10RA expression and were analyzed by flow cytometry. Representative panels and quantitative data are shown. Each circle indicates an individual mouse. Error bars = SD, n = 5 per group. Significance: *, **, *** denote p < 0.05, 0.01 and 0.001, respectively
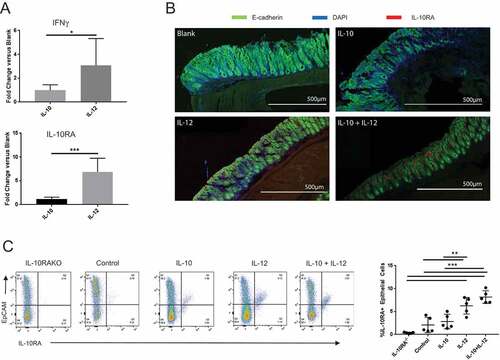
Figure 6. IFNγ and IL-10 jointly promote tight junction protein expression in the colon. (A) Quantitative PCR analysis of IL-10RA, occludin and claudin-4 transcripts. Colon explants were cultured for 24 hours in high glucose medium in the presence of recombinant IL-10, IFNγ, or both as described in Materials and Methods. RNA was extracted and IL-10RA, occludin and claudin-4 mRNA levels were quantified by qPCR. Error bars = SD, n = 6 per group. (B, C) Analysis of protein levels. Protein was extracted from colon explants cultured as above and analyzed by Western blotting to detect and quantify IL-10RA, occludin and claudin-4. (B) Western blot. Representative blot displaying the bands for each protein and β-actin (loading control) is shown. (C) Quantification of protein levels. Signal intensity of each band was normalized to β actin for loading in each lane and fold-change was calculated with respect to untreated (control) explants. Combined data from two different blots are shown. Error bars = SD, n = 5–6 per group. Significance: * denotes p < 0.05