Figures & data
Figure 1. Relevance of mutation specific T cell responses in CRC patients. IFN-γ ELISpot analysis with T cells derived from of peripheral blood (PB) and bone marrow (BM) samples of 26 CRC patients. (A) IFN-γ-ELISpot analysis of peripheral blood (PB) derived T cells from a representative (HLA-A*0201 negative) CRC patient carrying the mutation p53 R175H in their primary tumor. Mutated peptide responses were tested against wt peptide responses (black *) and the negative assay control ((-) IgG, gray *). Wt peptide responses were tested against the negative assay control ((-) IgG, gray *) applying unpaired Student’s t-test. The assay was conducted in triplicates. (B) Percentage of patients responding to tested mutated and wt peptides in INFγ-ELISpot analysis. Peptide responses were considered specific in case they were significantly higher than responses towards the negative assay control (IgG, see Figure 1 (A)) in unpaired t-test. (C) Frequency of peptide-specific T cell responses against wt and mutated peptides. Accumulated ELISpot data from blood and BM samples of 26 CRC patients (unpaired t-test). Peptide responses were considered specific in case they were significantly higher than responses towards negative assay control ((-) IgG, see Figure 1 (A)) in unpaired t-test. (D) Distribution of KRAS and TP53 mutations in the tumors and/or metastasis of the CRC patient analyzed previously by ELISpot assay. DNA for exon sequencing of TP53 and KRAS genes was derived from paraffin embedded tissue of primary tumors and metastases of 24 CRC patients. (E) T cell reactivity of patients against wt and mutated peptides correlated with the mutations detected in the patients’ tumors and/or metastasis. panel mut = patients carrying mutations included in the panel of long peptides, other mut = patients carrying TP53 and KRAS mutations different from the mutations included in the panel of long peptides.
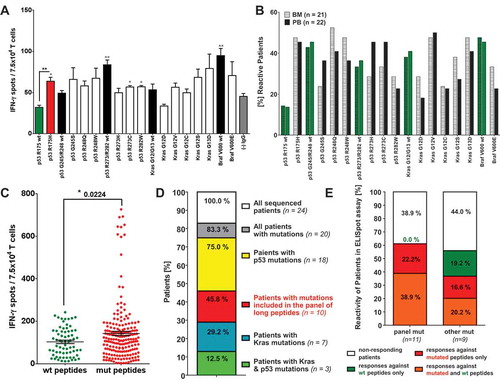
Figure 2. Mutation-specific, polyvalent CD4+ and CD8+ T cell responses after vaccination with mutated and wt p53 and Kras derived peptides. (A) Overview of recall responses against all peptides tested in HLA-humanized A2.DR1 dtg mice immunized with different long peptide cocktails. Six cohorts of mice were immunized with one group of mutated (mut) or wild-type (wt) peptides (A to F), each, in PBS-based formulations including 50 μg of CpG ODN 1668 as an adjuvant, twice on a bi-weekly bases. In vitro recall responses were obtained from combined IFN-γ secretion assays and intracellular cytokine stainings performed with CD90+ purified T cells from immunized mice. IFN-γ secretion of CD8+ and CD4+ T cells upon in vitro recall against single peptides of each respective mix (single) and against whole peptide mixes (mix) presented by CD11c+ DCs are displayed. Each peptide, peptide mix and control sample was tested in triplicates. Results are plotted as means of triplicate assays ± SEM. Data obtained from one of two identical lines of experiments are shown. (B)/(C) Mutation specific responses after vaccination of A2.DR1 dtg mice with mutated peptides. Percentages of IFN-γ secreting splenic CD8+ (B) and CD4+ (C) T cells upon in vitro recall against mutated (mut) and wild-type (wt) peptides represented on CD11c+ DCs. Results were accumulated from six cohorts of mice immunized with one group of mutated (mut) or wild-type (wt) peptides (A to F, see Figure 2 (A)). Means of mutated and wt peptide triplicates are plotted and groups were tested for differences by applying two-tailed Wilcoxon signed rank test. Representative data obtained from one of two identical lines of experiments are shown. Filled dot symbols: peptides used for vaccination and in vitro recall response testing, open dot symbols: peptides used for in vitro recall response testing only, ns: not significant.
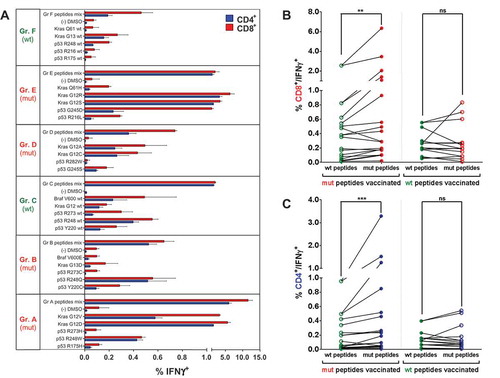
Figure 3. Vaccination-induced, mutation-specific T cells show poly-functionality. (A) IFNγ/IL-2 two-color cytokine secretion assay with splenic T cells purified from A2.DR1 dtg mice immunized with the most-immunogenic peptides (p53 R24Q/W, Kras G12V/D/R, vaccine regimen: peptides in PBS-based formulations including 50 μg CpG ODN 1668 as an adjuvant, twice on a bi-weekly basis). Cell surface markers were stained with fluorescently labeled monoclonal antibodies against IFN-γ (detection Ab), IL-2 (detection Ab), CD4, CD8, CD11c and NK1.1 (samples shown: T cells re-stimulated on DCs pulsed with wt peptide p53 R248 wt, mutated peptide p53 R248W, most immunogenic mutated peptides mixed; negative control: dendritic cells pulsed with peptide solvent (DMSO) only) . (B)-(D) Quantification of IFNγ/IL-2 two-color cytokine secretion assay shown in (A). In vitro recall responses were obtained from two-color cytokine secretion assays (IL-2, IFN-γ) with pan-T cells purified from immunized A2.DR1 dtg mice. Percentages of IFN-γ (B), IL-2 (C) and IFN-γ/IL-2 (D) double-positive of CD8+ and CD4+ T cells upon in vitro recall against single peptides, corresponding wt peptides and against whole peptide mixes (mix) presented by CD11c+ DCs are displayed. Results are plotted as means of triplicate assays ± SEM. (E) CD8+ effector T cells derived from Kras G12V and p53 R248W mutated peptides vaccinated mice express markers of cytotoxicity upon in vitro antigen-specific re-stimulation. Effector pan-T cells derived from A2.DR1 dtg mice vaccinated with Kras G12V/p53 R248W mutated peptides were in vitro re-stimulated for 12 h on different peptide pulsed DCs. Fluorescently-labeled anti-CD107a mAb and GolgiStop reagent were added to the co-culture. Thereafter, live-dead staining was performed and samples were fixed. Fixed cells were stained for markers granzyme B, IFN-γ, CD11c, CD4, and CD8 with fluorescent-labeled mAbs. CD107a plotted against granzyme B in CD8+ T cells are shown. Samples displayed: T cell re-stimulated on DCs pulsed with mutated peptide p53 R248W and mutated peptide Kras G12V, negative control: DCs pulsed with peptide solvent (DMSO) only. Percentages of granzyme B (F) and CD107a (G) positive of CD8+ and CD4+ T cells from all different peptide samples tested are shown.
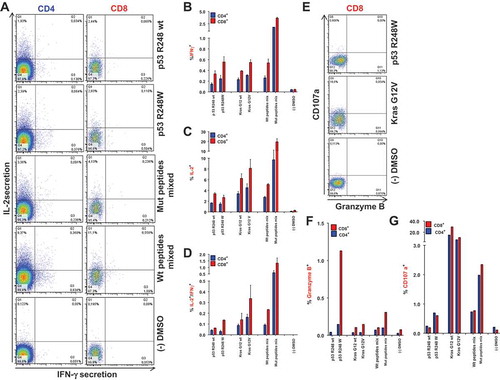
Figure 4. Mutated p53 R248W and Kras G12D/V peptides are more immunogenic than corresponding wt peptides when used for vaccination of A2.DR1 dtg mice and comprise HLA class I and II restricted epitopes. CD8+ (A) and CD4+ (B) T cell recall responses against mutated and wt peptides tested in A2.DR1 dtg mice immunized with group A and C long peptide cocktails (vaccination regimen: peptides in PBS-based formulations including 50 μg CpG ODN 1668 as an adjuvant, twice on a bi-weekly basis) or untreated mice are shown. In vitro recall responses were obtained from combined IFN-γ secretion assays and intracellular cytokine stainings performed with splenic CD90+ purified T cells from immunized mice. IFN-γ secretion of CD8+ T cells upon in vitro recall against respective single peptides presented by CD11c+ DCs are displayed. Each peptide and control sample was tested in triplicates. Results are plotted as means ± SEM. Differences were tested for by unpaired, two-tailed t-test. (C) Putative class I and II epitopes (highlighted in gray) within the long p53 R248W and Kras G12V peptide sequences. (D) – (G) T cell recall responses against mutated and wt Kras G12(V) and p53 R248(W) peptides tested in A2.DR1 dtg mice immunized with the long peptides Kras G12V or p53 R248W. In vitro recall responses were obtained from two-color cytokine secretion assays performed with splenic pan-T cells from immunized mice. Percentages of IFN-γ/IL-2 (D, E) double-positive CD8+ (C, D) and IFN-γ (F), IL-2 (G) positive CD4+ T cells upon in vitro recall against short and long Kras or p53 peptides presented by CD11c+ DCs are displayed. Each peptide and control sample was tested in triplicates. Results are plotted as means of triplicate assays ± SEM. Differences were tested for by unpaired, two-tailed t-test. ns: not significant.
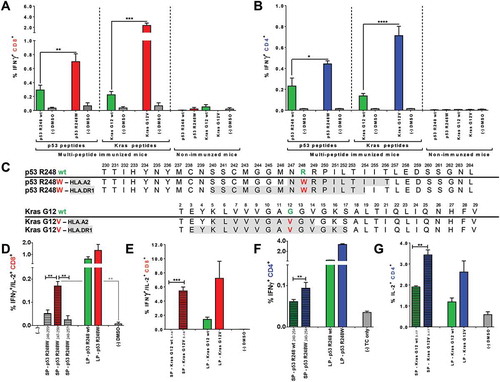
Figure 5. Tumor protection after vaccination with highly immunogenic peptides can be hampered by induction of mutation-specific regulatory T cells. (A) Vaccination schedule for tumor challenge experiments. Depot: IFA-based formulation, Boost: boost vaccination containing CpG ODN 1668 and peptides in PBS (water-based formulation). (B) Tumor growth curves of differently vaccinated A2.DR1 dtg mice inoculated with a 1:1 mixture of 2277-NS clones 5.2.2.1 and 5.2.2.2. In total 5 × 10Citation5 tumor cells were subcutaneously administered in 100 µl of Matrigel on the right flank of each animal on day 0. Three groups of 5 A2.DR1 dtg mice each (n = 5), have been vaccinated prior to the challenge according to the vaccination schedule shown in (A) with either mutated (‘mut’ group: p53 R248W, Kras G12V), wt (‘wt’ group: p53 R248 wt, Kras G12 wt), or irrelevant (‘irr’ group: IgG47–81, IgG273-304) peptides. Beginning on day 7 after tumor inoculation all groups of mice were fed 2 g/l DOX in the drinking water ad libitum until the end of the challenge experiment. Mice were boosted twice with respective water-based peptide/CpG formulations during the challenge. n: number of biological replicates; error bars: mean ± SEM (C)/(D) T cell responses against mutated and wt peptide sequences tested for in A2.DR1 dtg mice immunized with p53 R248W and Kras G12V mutated peptides or non-vaccinated mice either challenged with 2277-NS clone 5.2.2.2, parental line NS-2277 or from tumor-free mice are shown. In vitro recall responses were obtained from two-color cytokine secretion assays (IL-2, IFN-γ) with pan-T cells purified from immunized or non-vaccinated animals Percentages of IFN-γ or IFN-γ/IL-2 positive CD8+ and CD4+ T cells upon in vitro recall against single wt and mutated peptides presented by CD11c+ DCs are displayed. Each peptide and control sample was tested in triplicates. Results are plotted as means of triplicate assays ± SEM. (E) Percentage of splenic Treg cells in differentially vaccinated tumor bearing mice compared to non-tumor bearing mice on the day of sacrifice (day 38 of the tumor challenge experiment). Treg cells were stained for in whole splenocyte suspensions with fluorescent-labeled mAbs as CD4+CD3+CD25+Foxp3+ living cells in FACS. P values as per unpaired, two-tailed t-test are shown. irr: irrelevant, mut: mutated. (F) Mutated peptide p53 R248W and the corresponding wt peptide p53 R248 wt enhance antigen-specific Treg cell activity when used for vaccination. The antigen-specific activity of Treg cells purified from the spleen and lymph nodes of C57BL/6 mice vaccinated with mutated or wt peptides was analyzed in Treg specificity assays. Groups of n = 3 mice were vaccinated with either wt or mutated peptide mixes. Purified Treg cells were re-stimulated on CD11c+ DCs pulsed with single peptides of the same mix used for vaccination and corresponding wt or mutated peptides. The next day OVA323-339 antigen-specifically activated, proliferating OT-II CD4+ conventional T cells were added to the culture and proliferation was measured additional 2 days later via the uptake of radioactive labeled Citation3H-thymidine employing a scintillation counter. Respective control samples containing only peptide pulsed DCs and activated conventional OT-II T cells but no purified regulatory T cells were handled identically. This leads to two sets of triplicate data per tested peptide: one with Treg cells added and one without Treg cells. Percentages of specific suppression were calculated by using c.p.m. values of the different assay plates. Differences were tested for by unpaired, two-tailed t-test. ns: not significant.
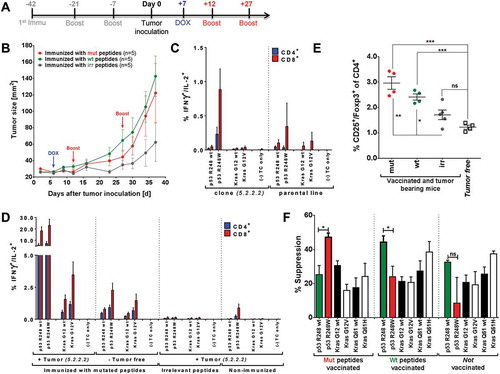
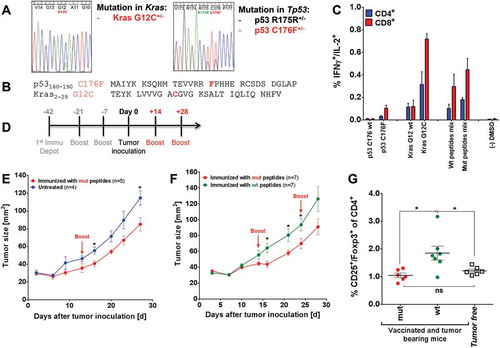
Figure 6. Mutated peptide vaccination induced T cell responses against intrinsic mutations in A2.DR1 dtg sarcoma and was superior to wt vaccination in controlling in vivo tumor growth (A) Sequencing histogram analysis of sarcoma cell line 39. Chromosomal DNA as well as cDNA of line 39 were used as templates for amplification with gene specific primers (Kras and Tp53). Amplified PCR products were analyzed by Sanger sequencing to detect mutations in Kras and Tp53 genes and mRNAs. (B) Amino acid sequences of the mutated peptides carrying intrinsic mutations used for vaccination. (C) Recall responses against mutated and wt peptides sequences tested in A2.DR1 dtg mice immunized with p53 R176F (mur) and Kras G12C mutated peptides (vaccination regimen: peptides in PBS-based formulations including 50 μg CpG ODN 1668 as an adjuvant, twice on a bi-weekly basis). In vitro recall responses were obtained from two-color cytokine secretion assays (IL-2, IFN-γ) with pan-T cells. Percentages of IFN-γ/IL-2 double positive CD8+ and CD4+ T cells upon in vitro recall against single wt and mutated peptides presented by CD11c+ DCs are displayed. Each peptide and control sample was tested in triplicates. Results are plotted as means of triplicate assays ± SEM. (D) Vaccination schedule for tumor challenge experiments. Depot: IFA-based formulation, Boost: boost vaccination containing CpG ODN 1668 and peptides in PBS (water-based formulation). (E) Tumor growth curves of vaccinated and untreated A2.DR1 dtg mice inoculated with sarcoma line 39. 2.5 x 10Citation5 tumor cells were subcutaneously administered in 100 µl of Matrigel on the right flank of each animal at day 0. One group of A2.DR1 dtg mice (n = 5) was vaccinated prior to the challenge according to the vaccination schedule shown in (D) with mutated (‘mut’ group: p53 C176F, Kras G12V) peptides. Mice were boosted only once with respective water-based peptide/CpG formulation during the challenge on day 14. n: number of biological replicates; error bars: mean ± SEM. Significances per unpaired two-tailed t-test are shown. (F) Tumor growth curves of differently vaccinated A2.DR1 dtg mice inoculated with sarcoma line 39. 2.5 x 10Citation5 tumor cells were subcutaneously administered in 100 µl of Matrigel on the right flank of each animal at day 0. Two groups of 7 A2.DR1 dtg mice each (n = 7), have been vaccinated prior to the challenge according to the vaccination schedule shown in (D) with either mutated (‘mut’ group: p53 C176F, Kras G12V) or wt (‘wt’ group: p53 C176 wt, Kras G12 wt) peptides. Mice were boosted twice with respective water-based peptide/CpG formulations during the challenge. n: number of biological replicates; error bars, mean ± SEM. (G) Number of splenic Treg cells of differentially vaccinated, tumor bearing mice of the experiment shown in (E) compared to non-tumor bearing mice on the day of sacrifice. Treg cells were stained for in whole splenocyte suspensions with fluorescent-labeled mAbs as CD4+CD3+CD25+Foxp3+ living cells in FACS. Significance per unpaired two-tailed t-test are shown. vac: vaccinated, mut: mutated.