Figures & data
Figure 1. IL-21R deletion promoted tumor growth in hepatocellular carcinoma mouse models.
A–B, Hepa1–6 cells (1 × 10⁷) were subcutaneously inoculated into WT mice and IL-21R KO mice for 25 days. The changes in body weight (A) and tumor volume and gross morphology of the tumors (B) are shown in WT mice and IL-21R KO mice over time. The data are representative of four independent experiments, each using 4 to 6 mice per group. C–D, Hepa1–6 cells (2 × 10⁶) were intrahepatically inoculated into WT mice and IL-21R KO mice for 22 days. Data shown are the mean tumor size and representative tumor morphology (IL-21R KO, n = 12, WT, n = 10) (C) and hepatosomatic indices (IL-21R KO, n = 21, WT, n = 20) (D). E, Survival time was determined in WT mice (n = 28) and IL-21R KO mice (n = 36) with orthotopic HCC inoculation. Data represent the mean ± SEM. *, P < 0.05; **, P < 0.01; ***, P < 0.001.
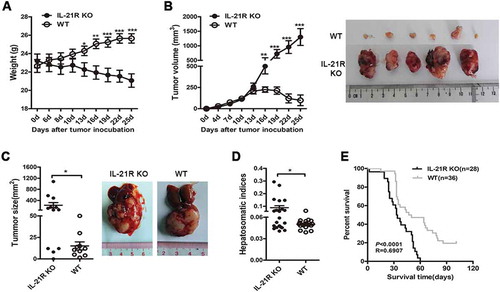
Figure 2. IL-21R deficiency decreased antitumor lymphocyte infiltration and function in tumors in the HCC mouse model.
A, Representative images of HE and IHC staining for CD4, CD8, CD20, CD68, and IL-21 in subcutaneous tumors in WT and IL-21R KO mice on day 25. Original magnification, × 200 for HE, × 400 for IHC; scale bar, 50 μm. B-G, IILs from orthotopic HCC mice were collected on day 15 and 22 post-inoculation and analyzed by flow cytometry. The percentages of CD4+ T cells and CD8+ T cells in intrahepatic lymphocytes from tumor-bearing mice were examined on day 15 and 22 post-inoculation (B). The percentages of CD8+CD44+, CD4+CD44+, CD8+CD62L+ and CD4+CD62L+ T cells in intrahepatic lymphocytes from tumor-bearing mice were examined on day 15 and 22 post-inoculation (C, D). The gating strategy for memory CD4+ and CD8+ T cell in the liver of orthotopic HCC mice (E). The frequencies of memory CD4+ or CD8+ T cells in figure E are shown (F,G). H, After stimulation with anti-CD3/28 mAbs, the cytokine production of IFNγ, IL-21, IL-17A and IL-10 from WT or IL-21R KO CD4+ T cells from the livers of orthotopic HCC mice was examined on day 22 post-inoculation. I, Representative flow cytometric plots and frequencies of WT or IL-21R KO CD8+ T cells from the livers of orthotopic HCC mice producing IFNγ and CD107A after stimulation with PMA/ionomycin were shown on day 22 post-inoculation. Data represent the means of four to six mice per group ± SEM and are representative of two experiments. *, P < 0.05; **, P < 0.01; ***, P < 0.001.
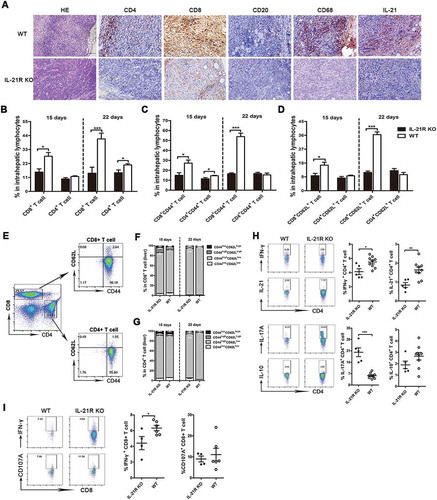
Figure 3. IL-21R deficiency increased immunosuppressive cells in liver tumors from orthotopic HCC mice.
IILs from orthotopic HCC mice were collected on day 22 post-inoculation and analyzed by flow cytometry. A, The gating strategy for MDSCs, G-MDSCs, M-MDSCs and macrophages in livers of orthotopic HCC mice. B, The frequencies of myeloid populations in liver mononuclear cell orthotopic HCC mice were examined on day 15 and 22 post-inoculation. C-D, The frequencies of WT or IL-21R KO G-MDSCs (C) and M-MDSCs (D) from livers of orthotopic HCC mice producing Arg-1 and NOS2 after stimulation with PMA/ionomycin were determined on day 22 post-inoculation. E-F, Quantitative reverse transcriptase (qRT)-PCR analysis of the expression of chemokine genes (E), MDSCs expansion and proangiogenic genes (F) in liver tumor tissues from WT or IL-21R KO mice. Data represent the means of four to six mice per group ± SEM and are representative of two experiments. *, P < 0.05; **, P < 0.01; ***, P < 0.001.
Figure 4. Loss of IL-21R led to decreased antitumor lymphocytes and increased accumulation of myeloid-derived suppressor cells in the spleen and LN in orthotopic HCC mice.
Splenocytes and MLN cells from orthotopic HCC mice were collected on day 15 and 22 post-inoculation and analyzed by flow cytometry. A, The frequencies of CD4+ T cells and CD8+ T cells in the spleen from orthotopic HCC mice were examined on day 15 and 22 post-inoculation. B-C, The percentages of CD8+CD44+, CD4+CD44+, CD8+CD62L+ and CD4+CD62L+ T cells in the spleen from orthotopic HCC mice were examined on day 15 and 22 post-inoculation. D, The frequencies of myeloid populations in the spleen of orthotopic HCC mice was examined on day 15 and 22 post-inoculation. The frequencies of B cells, CD11c+ DCs, cDCs, and pDCs of splenocytes (E) and MLN (J) from orthotopic HCC mice were determined on day 22 post-inoculation. F, Expression levels of MHCII in B cells and CD11c+ DCs in the spleen were determined on day 22 post-inoculation. G, The frequencies of CD4+ T cells and CD8+ T cells in the MLN from orthotopic HCC mice were examined on day 22 post-inoculation. H, The frequencies of CD8+CD44+, CD8+CD62L+, CD4+CD44+, and CD4+CD62L+ T cells of MLN from orthotopic HCC mice were examined on day 22 post-inoculation. I, The frequencies of myeloid populations in MLN from orthotopic HCC mice were determined on day 22 post-inoculation. Data represent the means of four to six mice per group ± SEM and are representative of two experiments. *, P < 0.05; **, P < 0.01; ***, P < 0.001.
Figure 5. Defects in secondary immune response in IL-21R KO tumor-bearing mice.
WT and IL-21R KO mice were subcutaneously inoculated with Hepa1-6 cells in the left groin and then reinoculated with Hepa1-6 cells in the right groin on day 25, and kinetics and profiles of primary and secondary immune cells in PB were determined over time. A, Tumor volume of the tumors is shown in WT mice and IL-21R KO mice subcutaneously inoculated with Hepa1-6 cells in the left groin for 35 days. B, Tumor volume of two inoculations is shown in WT mice and IL-21R KO mice subcutaneously inoculated with Hepa1-6 cells for 10 days. C, The frequency of CD3+ T cells in the PB of individual mice was examined. D, The frequencies of CD4+ T cells, CD4+CD44+ cells, and CD4+CD62L+ T cells in the PB of individual mice were examined. E, The frequencies of CD8+ T cells, CD8+CD44+ cells, and CD8+CD62L+ T cells in the PB of individual mice were examined. F, The frequencies of CD11b+ T cells, MDSCs, G-MDSCs, M-MDSCs, and macrophages in the PB of individual mice were measured. Data represent the means of four to six mice per group ± SEM and are representative of two experiments. *, P < 0.05; **, P < 0.01; ***, P < 0.001.
Figure 6. Defective expansion of antitumor immune cells in the spleen in IL-21R KO mice after secondary inoculation.
WT and IL-21R KO mice were subcutaneously inoculated with Hepa1-6 cells in the left groin and then reinoculated with Hepa1-6 cells in the right groin on day 25 after the first inoculation. After days 35 and 43, splenocytes were collected and measured by flow cytometry. A, The frequencies of CD4+ T cell, CD4+CD44+ and CD4+CD62L+ T cells in splenocytes from tumor-bearing WT and IL21R KO mice and naive mice are shown. B, The frequencies of CD8+ T cell, CD8+CD44+ and CD8+CD62L+ T cells in splenocytes from tumor-bearing WT and IL21R KO mice and naive mice were measured. C, The frequencies of B cells, DCs, cDCs, and pDCs in splenocytes from tumor-bearing WT and IL21R KO mice and naive mice were examined. D, The frequencies of MDSCs, G-MDSCs, M-MDSCs, and macrophages from splenocytes from tumor-bearing WT and IL21R KO mice and naive mice are shown. Data represent the means of five to six mice per group ± SEM and are representative of two experiments. s.c., subcutaneous injection. *, P < 0.05; **, P < 0.01; ***, P < 0.001.
Figure 7. High IL-21 expression in non-tumor tissues and high IL-21R expression in tumor tissues are associated with good prognosis in HCC patients.
The correlations of IL-21 expression level in non-tumor tissues and IL-21R expression level in tumors and the prognosis of HCC patients were analyzed by the Kaplan-Meier method (data from GSE14520). The expression levels of IL-21 (A) and IL-21R (D) in tumor and non-tumor tissues from HCC patients. B-C, The association of IL-21 expression level in non-tumor tissues and the overall survival (B) and the recurrence (C) of patients with HCC. E-F, The association of IL-21R expression level in tumors and the overall survival (E) and the recurrence (F) of patients with HCC. Data represent the mean ± SEM. *, P < 0.05; **, P < 0.01; ***, P < 0.001.