Figures & data
Figure 1. In vitro expression of key molecules for immune interaction by SB28 and GL261 glioma lines. Flow cytometry was used to assess surface expression of the indicated markers by SB28 (A) and GL261 (B). Filled curves: specific antibody staining (Ab); open curves: isotype control antibody (iso). Lower light-gray histograms show constitutive expression (-IFNγ); upper dark-gray histograms show staining of cells stimulated for 48 hours with 100 U/ml IFNγ (+ IFNγ). Representative staining profiles of 3 independent experiments.
Figure 2. SB28 has a far lower mutational load than GL261 glioma. Whole exome sequencing (WES) was performed for in vitro SB28 (A) and GL261 (B), red circle size represents total number of non-synonymous somatic mutations (missense and frameshift). Outer circles represent pathways targeted by mutations, the most targeted for SB28 is highlighted in green, and corresponds to the PDGF signaling pathway. (Details of pathways targeted in Supplementary Table S1.).
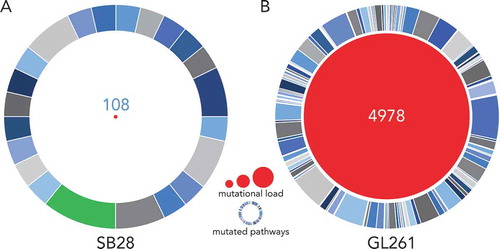
Figure 3. High tumorigenicity of SB28 and GL261 gliomas after orthotopic implantation. (A) Mice injected intracranially with the indicated numbers of SB28 glioma cells, or with 50,000 GL261 glioma cells; symptom-free survival is plotted, with corresponding median survival (MS) shown. (B) Hematoxylin and eosin staining (coronal section) from an SB28 implanted mouse at appearance of terminal symptoms, dashed line outlines tumor based on hypercellularity. (C, D, E) Representative photomicrographs showing tumor cells (GFP+), CD3+ T cells (C, D), and CD31+ vessels (E). Scale bar: 50 µm.
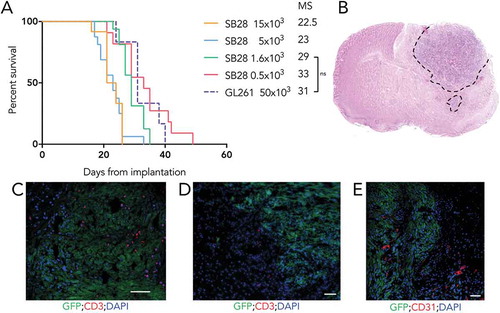
Figure 4. For SB28, number of predicted MHC-I neoepitopes increases after in vivo growth. (A) Circos plot showing genomic distribution of mutations and predicted neoepitopes, representative example of in vitro SB28. From outer to inner, representation of mouse karyotype, point mutation (based on allele frequency (missense all freq), inner is 0 outer is 0.5), MHC-I predicted peptides (plotted according to affinity inner 13.4 nM, outer 33880 nM), MHC-II predicted peptides (plotted according to affinity inner 213.9 nM, outer 27834.1 nM), frameshift mutations. (B, C) numbers of expressed mutated genes and predicted neoepitopes for MHC-I and MHC-II binding.
Figure 5. Differential sensitivity of SB28 and GL261 to double ICB. (A) Mice implanted intracranially with tumor were randomized into groups to receive intraperitoneal treatment with anti-PD-1 and anti-CTLA-4 antibodies, or isotype control, at the indicated doses and time-points. (B) Symptom-free survival of mice implanted with 1,600 SB28 glioma cells. (C) Symptom-free survival of mice implanted with 50,000 GL261 glioma cells. Survival curves represent accumulated data from two independent experiments (12 mice/group).