Figures & data
Figure 1. Comprehensive flow cytometric analyses of lymphocytic subsets in gastro esophageal adenocarcinoma. Single cell suspensions of primary tumor samples (n = 28), tumors of patients following neoadjuvant treatment (n = 19) or normal mucosa (n = 23) were analyzed for the percentage of CD45+ lymphocytes by flow cytometry (A). Lymphocytic subsets in PBMC of healthy controls (PBMC HC, n = 20), PBMC of untreated tumor patients (PBMC AC, n = 46), tumor samples (n = 28) and tumor-draining lymph nodes (TDLN, n = 23) were analyzed for the percentages of total B cells (B), CD86+ activated B cells (C), IgD−CD27+ memory B cells (D), CD3+PD-1+ activated T cells (E) and CCR7−CD45RA− effector memory T cells (F). Additional plots compare B cell subsets in low (UICC I and II) and high (UICC III and IV) tumor stages (B-F). Graphs show mean values ± SEM, p = ANOVA, *p < 0.05.
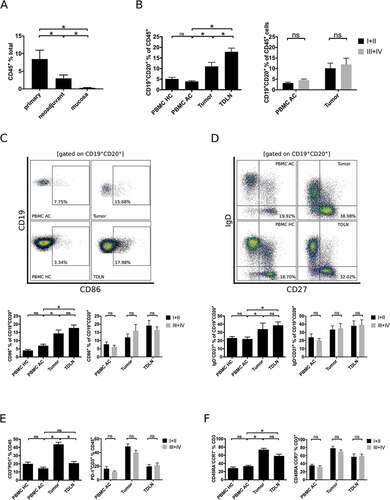
Figure 2. B cells in gastro-esophageal adenocarcinoma are mainly localized in tertiary lymphoid structures (TLS). B cells in tumor sections of gastro-esophageal adenocarcinoma were stained by immunohistochemistry for CD20 (A). Lymphocytic subsets in PBMC of healthy controls (PBMC HC, n = 20), PBMC of untreated tumor patients (PBMC AC, n = 46), tumor samples (n = 28) and tumor-draining lymph nodes (TDLN, n = 23) were analyzed by flow cytometry for the percentages of CD4+CXCR5+CCR7−CD45RA− follicular T helper cells (B), CD20−CD27+CD38++ plasmablasts (C) and CD20−CD27+CD38++CD138+ plasmacells (D). Presence of lymphatic vessels (PNAd) and follicular dendritic cells (FDC-M1) as additional components of TLS is demonstrated by confocal microscopy (E). CD38+ B cells were visualized by confocal microscopy of CD19, CD38 and CD3 (F). Graphs show mean values ± SEM, p = ANOVA, *p < 0.05.
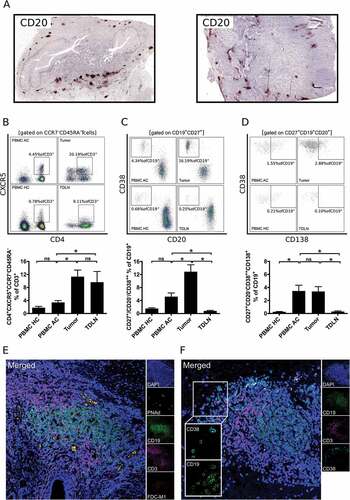
Figure 3. Heatmap showing an overview of analyzed lymphocytic subsets normalized to results obtained from PBMC of healthy controls (PBMC HC = 1).
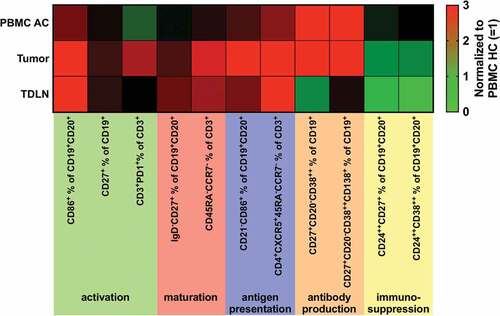
Table 1. Mean fluorescence intensities for 34 tumor associated antigens analyzed in serum samples of gastroesophageal adenocarcinoma patients (positive = MFI> 250, negative = MFI< 250) and healthy controls. Expression levels of analyzed antigens in external cohorts of esophageal adenocarcinoma samples (TCGA n = 185) and normal esophageal mucosa samples (GTEx n = 300, ArrayExpress n = 6, TCGA n = 13).
Figure 4. Analysis of the tumor antigen-specific B cell response in gastro-esophageal adenocarcinoma. LUMINEXTM analyses of 34 TAAs were performed in serum samples of untreated gastro-esophageal adenocarcinoma patients (n = 34), serum samples following neoadjuvant chemoradiotherapy (n = 7) and healthy controls (n = 5) was analyzed by LUMINEXTM (A). Individual MFIs for CTAG1A and MAGEA4 (B). Summary of antibody responses detected in serum samples of tumor patients and healthy controls (C) Exemplary flow cytometry analyses of b cells specific for NY-ESO-1 (CTAG1A) in PBMC and TDLN of a gastro-esophageal adenocarcinoma patient using biotinylated NY-ESO-1 and a streptavidin tetramer (D). Heatmap and bar graphs of LUMINEXTM data show mean MFIs of duplicates, p = ChiCitation2 test.
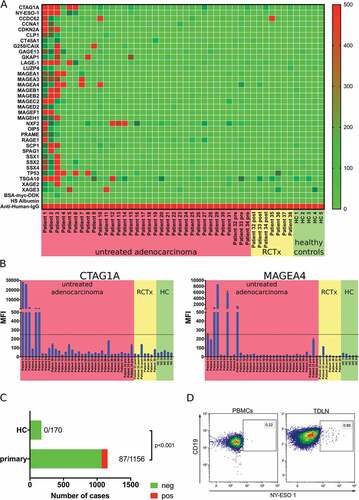
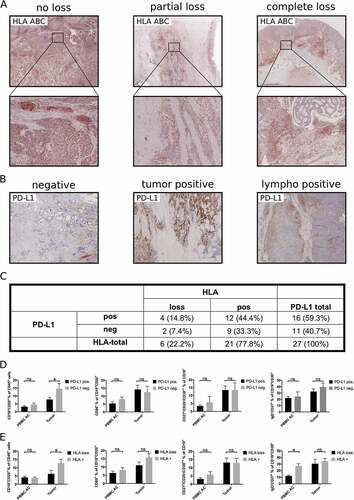
Figure 5. Influence of immune escape mechanisms on tumor associated B cells. HLA-loss (A, C) and expression of PD-L1 (B, C) was assessed by immunohistochemistry in 27 primary tumor samples. PBMC of these patients (PBMC AC) or single cell suspensions of tumor samples were analyzed by flow cytometry for the presence of different B cell subsets according to their expression of PD-L1 (D) or HLA-loss (E). Bar graphs show mean percentages of flow cytometric data, p = ANOVA, p < 0.05.