
Figures & data
Figure 1. IL-33 delays ovarian cancer tumor progression.
(A) Schematic of IL-33 survival experiments (B) Survival plot of mice bearing intraperitoneal ID8-Defb29/Vegf-a syngeneic tumors treated intraperitoneally with IL-33 or PBS at days 7, 14, 21, 28 and 35 after tumor challenge (n = 9 per group, pooled from 2 independent experiments). (C) Expression flow cytometry of ST2 receptor by ID8-Defb29/Vegf-a (2 independent experiments) (D) ID8-Defb29/Vegf-a in vitro proliferation in the presence of IL-33 (n = 3 per group; 2 independent experiments) (E) Survival plot of mice bearing intraperitoneal Lewis lung carcinoma treated intraperitoneally with IL-33 or PBS at days 7, 8, 9, 10 and 11 after tumor challenge (n = 5 per group). (F) Peritoneal wash of mice bearing intraperitoneal ID8-Defb29/Vegf-a syngeneic tumors treated intraperitoneally with IL-33 or PBS at days 21 and 28, harvested at day 30 (n = 3mice per group; 3 independent experiments). (G) Cell count from peritoneal wash of mice bearing intraperitoneal ID8-Defb29/Vegf-a syngeneic tumors treated intraperitoneally with IL-33 or PBS at days 21 and 28, harvested at day 30 (> 3 independent experiments). (H) Representative flow cytometry plots of the ascites fluid (tumor microenvironment) of mice bearing intraperitoneal ID8-Defb29/Vegf-a syngeneic tumors treated intraperitoneally with mature IL-33 or PBS at days 21 and 28, harvested at day 30. (> 3 independent experiments). Log-Rank test, ANOVA, t-test. AU: arbitrary units, ns: not significant, **p < 0.01, ***p < 0.001.
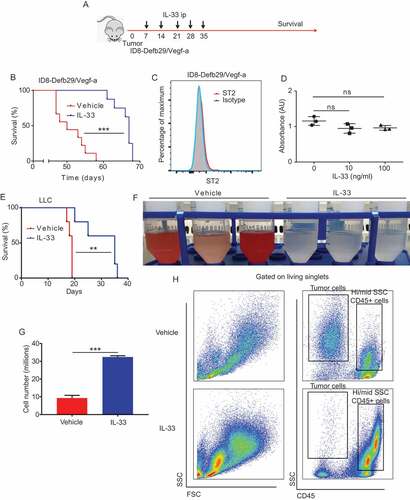
Figure 2. IL-33 promotes an allergic like infiltration of the peritoneal cavity.
Mice were challenged with intraperitoneal ID8-Defb29/Vegf-a tumors and treated at days 7,14 and 21 with intraperitoneal IL-33 or PBS. Two days later we performed a peritoneal wash and analyzed the peritoneal cellular compartment. (A) Quantitative real time PCR showing relative quantification of IL-5, (B) IL-13 (product of IL-13 and GAPDH of each mouse shown in agarose gel), (C) IL-10, (D)ST2 and (E)Ym1 from IL-33 treated mice relative to PBS treated mice (n = 5 mice per group). t-test. ns: not significant, *p < 0.05, ***p < 0.001.
Figure 3. IL-33 promotes recruitment and activation of peritoneal CD4 T cells.
(A) Number of CD3+ cells in the peritoneal cavity of mice bearing intraperitoneal ID8-Defb29/Vegf-a treated with IL-33 or PBS (n = 5 mice per group, 2 independent experiments) (B) Representative flow cytometry plots and (C) percentage values of CD4+ and CD8+ T-cells in the peritoneal cavity of mice bearing intraperitoneal ID8-Defb29/Vegf-a treated with IL-33 or PBS (n = 5 mice per group, 2 independent experiments). (D) Representative flow cytometry plots showing CD44 and CD69 of CD4+ and CD8+ T-cells from the peritoneal cavity of ID8-Defb29/Vegf-a bearing mice treated with IL-33 or PBS (n = 5 mice per group, 2 independent experiments) (E) Mean fluorescence intensity of CD40L from CD4+ T-cells from of ID8-Defb29/Vegf-a bearing mice treated with IL-33 or PBS (n = 5 mice per group, 2 independent experiments). t-test and ANOVA. ns: not significant, **p < 0.01 ***p < 0.001.
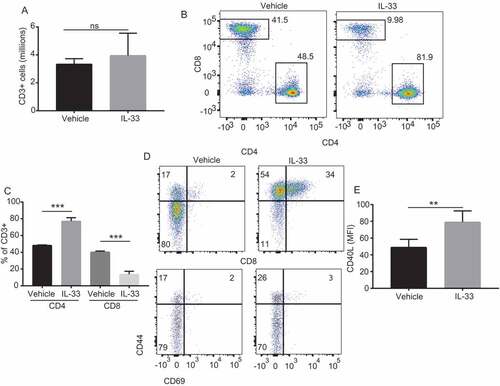
Figure 4. IL-33 promotes peritoneal CD4 T-cell and B cell activation and eosinophil recruitment.
(A) Real-time quantitative-PCR of IL-5 expression in CD4+ T-cells sorted from the peritoneal cavity of mice bearing intraperitoneal ID8-Defb29/Vegf-a syngeneic tumors treated intraperitoneally with IL-33 or PBS (triplicates, pooled from 5 mice per group, 2 independent experiments). (B) Percentage of CD4+ T-cells expressing IL-5 in the peritoneal cavity of mice bearing intraperitoneal ID8-Defb29/Vegf-a tumors treated intraperitoneally with IL-33 or PBS (n = 5 per group). (C) Real-time quantitative-PCR of IL-13 expression in CD4+ T-cells sorted from the peritoneal cavity of mice bearing intraperitoneal ID8-Defb29/Vegf-a (triplicates, pooled from 5 mice per group (D) Levels of MHCII expressed in B-cells from the peritoneal cavity of mice bearing intraperitoneal ID8-Defb29/Vegf-a tumors treated intraperitoneally with IL-33 or PBS (n = 5 per group, 2 independent experiments). (E) Histogram showing levels of IgE in peritoneal fluid obtained by paracentesis from mice bearing intraperitoneal ID8-Defb29/Vegf-a syngeneic tumors treated intraperitoneally with IL-33 or PBS (pooled of 3 independent experiments with n = 3–5 mice per group each). (F) Real-time quantitative-PCR of IL-13 expression in B-cells sorted from the peritoneal cavity of mice bearing intraperitoneal ID8-Defb29/Vegf-a (n = 5 per group). (G) Histogram and flow cytometry plots showing the percentage of eosinophils the peritoneal cavity of mice bearing intraperitoneal ID8-Defb29/Vegf-a tumors treated intraperitoneally with IL-33 or PBS (n = 5 per group, 2 independent experiments). T-test. *p < 0.05 ***p < 0.001.
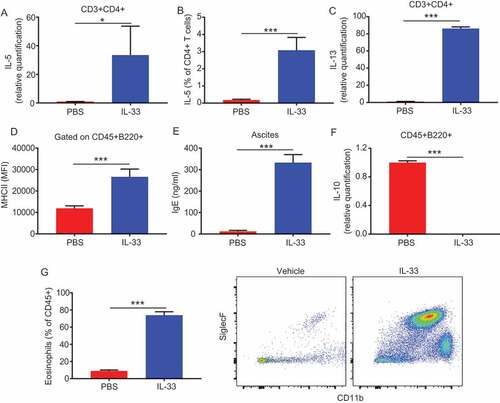
Figure 5. IL-33 promotes activation of peritoneal macrophages.
Mice were challenged with intraperitoneal ID8-Defb29/Vegf-a tumors and treated at days 7,14 and 21 with intraperitoneal IL-33 or PBS. Two days later we performed a peritoneal wash and performed peritoneal cell staining for flow cytometry and flow cytometry associated cell sorting of CD11b+F4/80+ peritoneal macrophages. (A) Quantitative real time PCR showing relative quantification of Ym1, (B) IL-13, (C) ST2 and (D) IL-10 from IL-33 treated mice relative to macrophages from PBS treated mice. Mean fluorescence intensity of macrophages stained for (E) CD40, (F) CD80 and (G) CD86 from IL-33 or PBS treated mice. (triplicates, pooled from 5 mice per group, 2 independent experiments, 2 independent experiments). t-test. *p < 0.05 ***p < 0.001
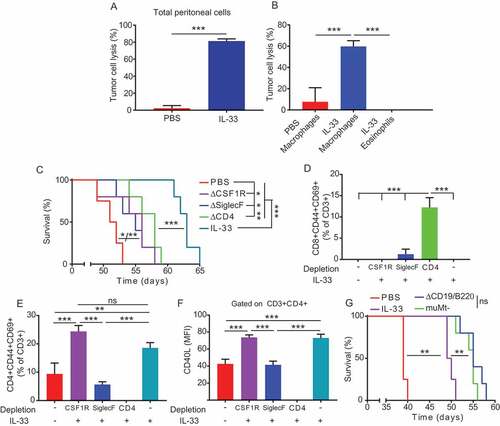
Figure 6. Maintenance of the Th2 response is necessary for the IL-33 mediated delay tumor progression in ovarian cancer.
(A) Cytotoxicity of peritoneal cells from IL-33 or PBS treated ID8-Defb29/Vegf-a bearing mice measured by luciferase absorbance after co-culture of 18 hours with ID8-Defb29/Vegf-a-luciferase tumor cells (triplicates, 2 independent experiments). (B) Cytotoxicity of macrophages or eosinophils sorted from the peritoneal cavity of IL-33 or PBS treated ID8-Defb29/Vegf-a bearing mice measured by luciferase absorbance after co-culture of 18 hours with ID8-Defb29/Vegf-a-luciferase tumor cells in the presence of 100ng/ml of IL-33 (triplicates, 2 independent experiments) (C) Survival plot of mice bearing intraperitoneal ID8-Defb29/Vegf-a tumors treated intraperitoneally with mature IL-33 or PBS at days 7, 14, 21, 28 and 35 after tumor challenge with anti-mouse CSF1R, Siglec-F or CD4 antibodies or irrelevant IgG (n = 5 per group). (D) Percentage of activated (CD44+CD69+) CD8+ T-cells in the peritoneal cavity of the different groups shown in (D). (E) Percentage of activated (CD44+CD69+) CD4+ T-cells in the peritoneal cavity of the different groups shown in (D). (F) CD40L expression of CD4+ T-cells in the peritoneal cavity of the different groups shown in (D) measured as mean fluorescent intensity. (G) Survival plot of mice bearing intraperitoneal ID8-Defb29/Vegf-a tumors treated intraperitoneally with mature IL-33 or PBS at days 7, 14, 21, 28 and 35 after tumor challenge with or without B cell depletion or B cell KO (muMt-) (n = 5 per group).t-test, ANOVA, Log Rank. *p < 0.05, **p < 0.01, ***p < 0.001.
Supplemental material