Figures & data
Figure 1. Higher expression of MALAT1 in HCC clinical samples and cell lines. A) Relative expression of MALAT1 in HCC tumor and paired non-tumorous tissues from TCGA. B) Relative expression of MALAT1 was detected in tumors and paired non-tumorous tissues of 92 HCC patients. C) Relative expression of MALAT1 in normal liver cell line and HCC cell lines. Results are normalized by human GAPDH and presented relative to normal liver cell line HL-7702. Data are shown as mean± s.e.m. (n = 3), *P < 0.05, **P < 0.01, ***P < 0.001.
Figure 2. MALAT1 suppresses cell apoptosis while promotes proliferation, invasion of HCC cells. HCC cells, QGY-7701 and QGY-7703, were transfected with negative control (mal_nc) or MALAT1 smart silence (mal_sm) at 50nM for 48h. A-B) QGY-7701 A) and QGY-7703 B) cell growth were measured by EdU incorporation. C-D) Apoptotic QGY-7701 C) and QGY-7703 D) cells were analyzed by FACS. The AnnexinV positive cells were regarded as apoptosis cells. E-F) The invasive ability of QGY-7701 E) and QGY-7703 F) cells were evaluated by in vitro invasion assays. Scale bar = 500 μm. Data are shown one representative experiment. Similar results were obtained in at least three independent experiments.
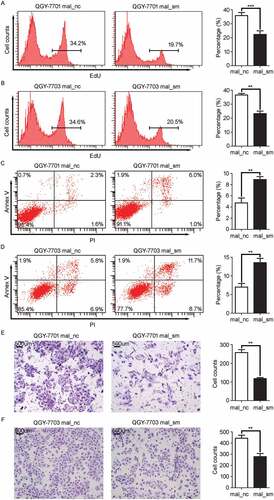
Figure 3. Knockdown of MALAT1 decreases LPS-induced IL-6 and CXCL8 expression in HCC cells. HCC cells, QGY-7701 and QGY-7703, were treated with mal_nc or mal_sm at 50nM for 48h. A, B) mRNA levels of IL-6 A) and CXCL8 B) in QGY-7701 and QGY-7703 cells were examined by RT-qPCR after exposure to LPS (1μg/ml) for 0 h, 2 h and 4 h respectively. C-D) Protein production of IL-6 C) and CXCL8 D) from QGY-7701 and QGY-7703 cells were determined using ELISA in response to LPS (1μg/ml) stimulation for 0 h, 6 h and 12 h. E-F) Transfection of 1 μg MALAT1 overexpression plasmid for 48 h after mal_nc/mal_sm transfected, relative expression of IL-6 and CXCL8 in QGY-7701 E) and QGY-7703 F) cells were examined by RT-qPCR after LPS (1 μg/ml) treatment for 0 h, 2 h and 4 h. GAPDH was used as an internal reference for RT-qPCR. Data are shown as mean± s.e.m. (n = 3). *P < 0.05, **P < 0.01, ***P < 0.001.
Figure 4. MALAT1 associates with BRG1 to promote IL-6 and CXCL8 expression in HCC cells in response to LPS stimulation. A) Western blotting (WB) was performed to analyze the levels of pP65 in mal_nc/mal_sm transfected HCC cells QGY-7701 and QGY-7703 in response to LPS (1 μg/ml) stimulation at indicate time. B) Biotinylated MALAT1 RNA pull down experiment combined with mass spectrometry is performed to identify its interacted protein. C) Immunoblot detection of BRG1 pulled down by sense (sen.) or antisense (ant.) MALAT1 transcripts from nuclear extract of HCC QGY-7701/QGY-7703 cells. D) RT-qPCR detection of MALAT1 in the immunoprecipitation complex by IgG or BRG1 antibody from HCC QGY-7701/QGY-7703 cell lysate. E) Relative expression of BRG1 in HCC QGY-7701/QGY-7703 cells after BRG1 siRNA/NC treating for 48 h at 20 nM was determined by RT-qPCR. F, G) mRNA and protein levels of IL-6 and CXCL8 were analyzed by RT-qPCR F) and ELISA G) respectively in HCC QGY-7701/QGY-7703 cells in response to LPS (1 μg/ml) stimulation for the indicated time after BRG1 siRNA/NC treating for 48 h. Data are shown as mean± s.e.m. (n = 3) (D, E, F, G). Data are shown one representative experiment (A, B, C). Similar results were obtained in three independent experiments. * P < 0.05, ** P < 0.01.
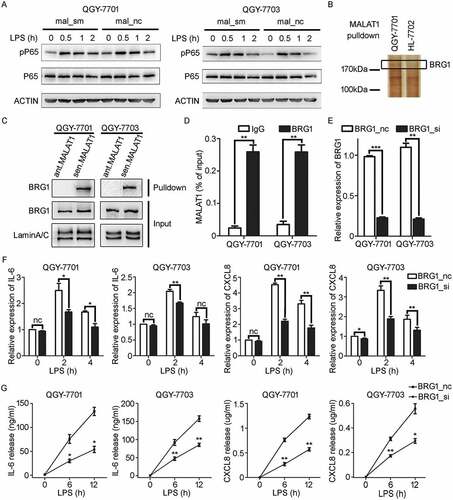
Figure 5. BRG1, recruited by MALAT1, binds to the promoter regions of IL-6 and CXCL8 loci in HCC cells in response to LPS stimulation. A, B) WB detection of the indicated proteins in input samples and in pP65- A) or BRG1- B) specific antibody immunoprecipitated samples in QGY-7701 or QGY-7703 cells with LPS (1 μg/ml) stimulation for 1 h. C, D) ChIP assay analysis for the recruitment of BRG1 to the promoter region of IL-6 C) and CXCL8 D) genes in QGY-7701 cells with LPS (1 μg/ml) stimulation for 1 h. E, F) ChIP assay analysis for the recruitment of pP65 to the promoter region of IL-6 E) and CXCL8 F) genes in QGY-7701 cells with LPS (1 μg/ml) stimulation for 1h. G, H) ChIP assay was performed to analyze the recruitment of BRG1 to promotors of IL-6 G) and CXCL8 H) in HCC cells once MALAT1 knockdown and followed by exposure to LPS (1 μg/ml) stimulation for 1 h. I, J) BRG1 si/nc treated cells further exposed to LPS (1 μg/ml) for 1 h, ChIP assay was performed to analyze the recruitment of pP65 to promotors of IL-6 I) and CXCL8 J) in HCC cells. Data are shown as mean± s.e.m. (n = 3) (C, D, E, F, G, H, I, J). Data are shown one representative experiment (A, B). Similar results were obtained in three independent experiments. * P < 0.05, ** P < 0.01.
Figure 6. In vivo knockdown of MALAT1 in HCC tissues suppresses HCC growth. A) RT-qPCR analysis of MALAT1 expression in SMMC-LTNM tumor tissue two weeks after intratumoral injection of cholesterol-conjugated MALAT1 silence (mal_aso) or negative control (mal_nc). B, C) Two weeks after subcutaneous inoculation of SMMC-LTNM tumor cells, HCC-bearing nude mice were treated by intratumoral injection of mal_aso or mal_nc, respectively. Tumor volume B) and serum AFP levels C) were shown. D) H&E staining and detection of Ki-67, MMP9, BCL2 and CD31 by IHC in HCC tissues was performed two weeks after intratumoral injection of cholesterol-conjugated mal_aso or mal_nc. IHC staining score were analyzed statistically (right panel). Scale bars = 50μm or 500μm. Data are shown as mean± s.e.m. (n = 3) (A, B, C and D). Data are shown one representative experiment (D) Similar results were obtained in three independent experiments. * P < 0.05, ** P < 0.01.
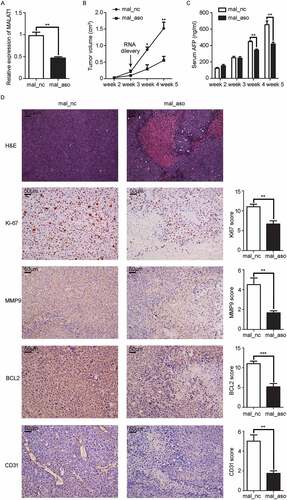
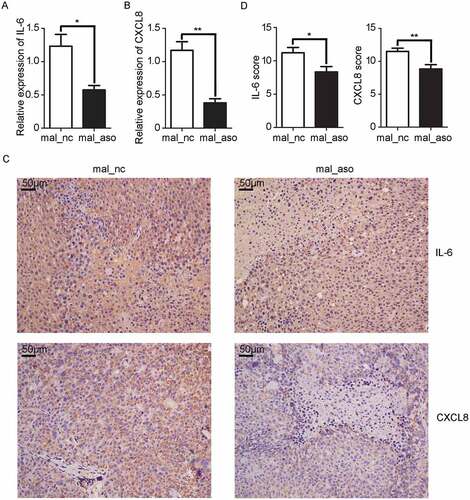
Figure 7. In vivo knockdown of MALAT1 inhibits inflammatory response in HCC tissues. A, B) RT-qPCR analysis of IL-6 A) and CXCL8 B) expression in HCC xenografts two weeks after intratumoral injection of cholesterol-conjugated MALAT1 silence (mal-aso) or negative control (mal-nc). C) Detection of IL-6 and CXCL8 by IHC in HCC tissues was performed two weeks after intratumoral injection of cholesterol-conjugated MALAT1 silence mal_aso or mal_nc. Scale bars = 50μm. D) IHC staining score of IL-6 and CXCL8 was made in mal_aso and mal_nc groups. Data are shown as mean± s.e.m. (n = 3) (A, B and D). Data are shown one representative experiment (C). Similar results were obtained in three independent experiments. * P < 0.05, ** P < 0.01.