
Figures & data
Figure 1. Distribution of human and murine leukocytes in HuMice and in breast cancer patients. (a) Experimental scheme of the study, as detailed in the text. (b) viSNE representation of gated human CD45+ cells in the spleen and the tumor of HuMice from a representative experiment. The viSNE plot was generated according to NKp46, CD38, CD33, CD45RO, PD-1, CD4, CD8, CD20, CD25, Grz-B, and HLA-DR expression using proportional sampling with 54422 events in the spleen and 10274 events in the tumor. The level of expression of each of the indicated markers is represented by a color scale on the right. (c) Frequencies of the indicated subsets were determined in HuMice by supervised 2D-gating from CyTOF data and in patients by multi-parametric flow cytometry. Each dot represents a mouse from four independent experiments or a patient in individual experiments. The horizontal line represents the mean value. The p-values indicated in the figures are from non-parametric two-tailed Mann–Whitney t-test.
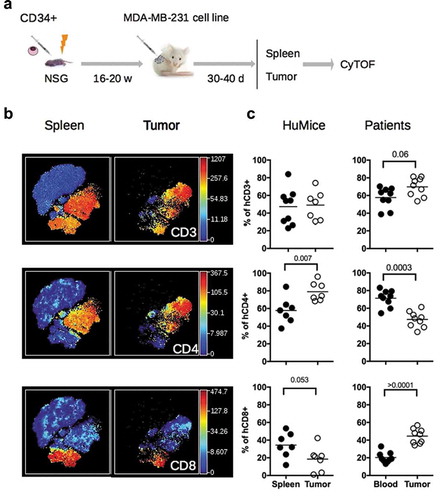
Figure 2. Detection of human myeloid cells and NK cells in HuMice. (a) The viSNE plot was generated as in and represents the expression of CD33 and HLA-DR in hCD45+ cells of the spleen and tumor. (b) The viSNE plots were generated in gated hCD45+CD33+ cells according to CD14, CD45RO, CD123, CD4, CD11b and HLA-DR expression using proportional sampling with 535 cells in the spleen and 476 events in the tumors. Indicated on the plots are the frequencies of CD14-expressing cells in the CD33+ cluster. (c) The visNE plots were generated as in and represent the expression of Granzyme-B (Grz-B) and NKp46 in the spleen and the tumor. Gates highlight the localization of putative NK cells.
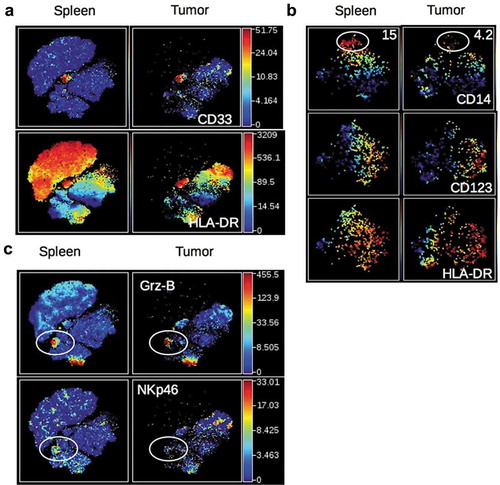
Figure 3. Activation status of Tumor-infiltrating T cells of HuMice and breast cancer patients. (a) hCD45+CD3+ from HuMice were gated in Cytobank and a viSNE plot was generated according to CD4, CD8, CD45RO, HLA-DR, PD-1, CD25, Ki-67 and GrzB expression using equal sampling with 8574 events in the spleen and tumor. (b) Mean frequencies of cells expressing 0, 1, any combination of two or all three activation/memory markers are shown in the indicated tissue. Activation/memory markers used for boolean analysis were CD25, HLA-DR, and PD-1 for CD4+ T cells and HLA-DR, Grz-B, and CD45RO for CD8+ T cells. Results are from one experiment out of three. (c) Same analysis for T cells from breast cancer patients. Results are mean frequencies in nine breast cancer patients in nine independent experiments in the blood and the tumor determined by flow cytometry. The activation markers used for boolean analysis were HLA-DR, ICOS, and PD-1 for CD4+ T cells and CD45RA, Grz-B and HLA-DR for CD8+ T cells (negativity for CD45RA was considered as an activated/memory phenotype).
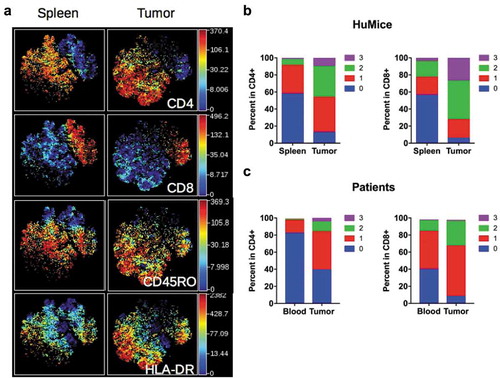
Figure 4. ICOS expression by Treg in HuMice and breast cancer patients. (a) viSNE plot of hCD45+ from a representative breast cancer patient showing FOXP3, ICOS and CD45RA expression in the blood and the tumor, determined by flow cytometry. (b) Frequencies of FOXP3+CD45RAneg cells in the indicated tissue from breast cancer patients among CD4+CD3+ cells. (c) Frequencies of ICOS+ cells in FOXP3lo or FOXP3hi CD4+CD45RAneg in the tumor of breast cancer patients. (d) MFI of ICOS in CD3+CD4+Foxp3− or CD3+CD4+Foxp3+ in the tumor of breast cancer patients or in the tumor of HuMice. The horizontal line represents the mean value. Each dot represents a patient or a mouse. The p values indicated on the graphs are from non-parametric two-tailed Mann–Whitney t-test.
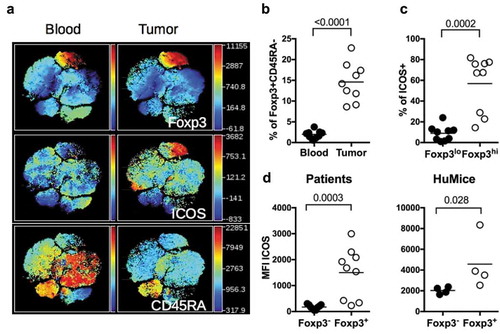
Figure 5. Impact of anti-ICOS mAb on Treg in humanized mice. (a) Frequencies of FOXP3+ICOS+ or FOXP3+CD25+ cells in CD4+CD3+ T cells and of (b) Ki-67+ cells in CD3+ T cells in the spleen and tumor of HuMice injected with isotype control (Iso) or anti-ICOS mAb (50µg/mouse). Results shown are cumulative of at least three independent experiments. Only high expressing cells were gated. The p-values reported on the graph are from a two-way ANOVA with multiple comparisons test corrected by the Sidak method. (c) Absolute numbers of total T cells (CD3+) or Treg (FOXP3+CD25+) were based on absolute counts of the spleen of HuMice treated with isotype control (Iso) or anti-ICOS mAb. Each dot represents a mouse. Fold change in mean numbers is indicated on the right. The p-values indicated on the graphs are from an unpaired two-tailed non-parametric Kolgomorov–Smirnov t-test. Data are cumulative of at least three independent experiments. The horizontal line represents the mean value.
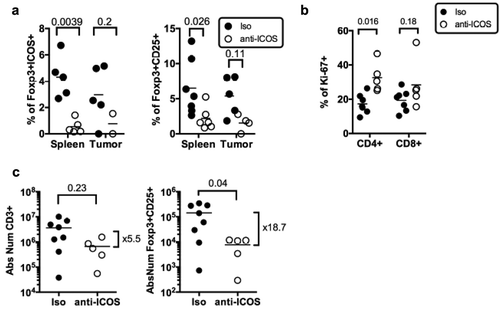
Figure 6. Impact of anti-ICOS mAb on tumor growth in HuMice. (a) Experimental design of the study, as detailed in the text. (b) Tumor growth was determined in four independent experiments in the indicated number of mice treated by PBS and isotype control (Vehicles), anti-ICOS and PBS (anti-ICOS; 50 µg/mouse), cyclophosphamide and isotype control (CTX; 1.5 mg/mouse) or a combination of CTX and anti-ICOS (Combo). Error bars are SEM. The arrow indicates the day the anti-ICOS, and the CTX treatment was performed. (c) Frequencies of Foxp3+CD25+ cells in CD4+CD3+ cells of the tumor in the indicated conditions. The CD8 to Treg ratio was obtained by dividing the frequencies of CD8+ T cells by the frequencies of Foxp3+CD25+ cells in CD3+ cells of the tumor in the indicated conditions. Each dot is a mouse and results are cumulative of two experiments.
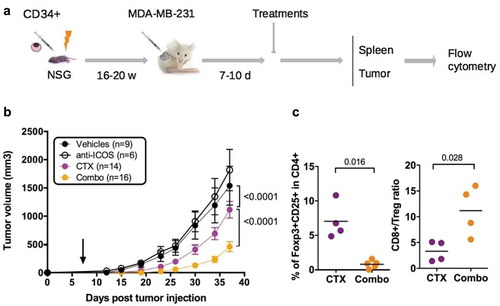
Figure 7. Role of human T cells and murine myeloid cells in the prevention of tumor growth by the combination of chemotherapy and anti-ICOS mAb. (a) Tumor growth in the absence of CD8+ T cells in the combo group. Neonatal CD34-reconstituted NSG mice were grafted s.c with the MDA-MB-231 cell line, injected with cyclophosphamide (CTX; 1.5 mg/mouse) and the anti-ICOS mAb (50 µg/mouse) with (Combo+a-CD8) or without (Combo) the MT807R1 recombinant Ig (10mg/kg) (b) Tumor growth was followed in HuMice treated with the combination of CTX and anti-ICOS mAb and an isotype control (Combo+Iso) or an anti-Gr1 mAb (200µg/mouse i.p). The first injection began 2 days before the combo treatment, followed by five injections, twice a week for 3 weeks. In this experiment, NSG female mice were humanized at the age of 3 weeks, then grafted as mentioned with the MDA breast cancer cell line. Results shown are cumulative of two independent experiments. The total number of mice is indicated in brackets. Error bars are SEM.
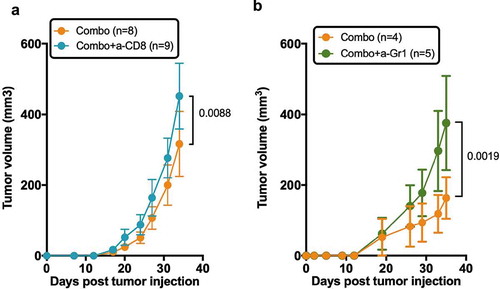
Table 1. Clinical characteristics of the primary breast tumors samples. Age = age of the patient at the time of surgery/Meno. status = Menopausal status/Histo. = Histologic type/Grad. = SBR Grade (histo-prognostic grade based on “Scarff-Bloom-Richardson”)/pTNM = tumor classification based on Tumor-Nodes-Metastasis score/ER = % of estrogen receptor positivity/PR = % of progesterone receptor positivity/Ki67% = cellular marker of proliferation/TILs = % of Tumor-infiltrated Lymphocytes.