
Figures & data
Figure 1. Intravenous administration of SC1 induces TLR7-dependent immune cell activation and IFNα-selective systemic cytokine release.
BALB/c and C57BL/6 wild-type (WT) mice and knock-out variants were injected i.v. with a single or repetitive dose of SC1 (3 mg/kg or as otherwise indicated) or vehicle (saline) every 5 d. (a) Kinetics of IFNα levels in sera of BALB/c WT mice were measured after a single injection of SC1. Data representative of two independent experiments. (b) BALB/c WT mice (n = 3) were given 6 serial i.v. injections of 3 mg/kg SC1 or vehicle (saline) every 5 d. Serum IFNα levels were measured 1 h after each injection. Data representative of two independent experiments. (c) Kinetics of cytokine levels in sera of BALB/c WT mice were measured after a single injection of SC1 or equimolar dose of R848 was measured by Multiplex. (d) CD69 surface expression on different lymphocyte subtypes in the spleen of C57BL/6 WT and knock-out mice 24 h after a single injection of SC1 was measured by flow cytometry (left); IFNα levels in sera 1 h after injection of SC1 was measured by ELISA (right). Data shown as mean ± s.e.m of (a) n = 4–15, (B-D) n = 3–5 mice per group, p*<0.05, p**<0.01, p***<0.001, p****<0.0001 using one-way ANOVA-test using saline as reference group, (c) at the peak of the expression.
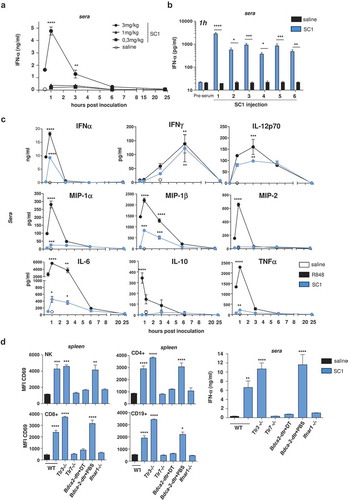
Figure 2. SC1 treatment of mice with established tumors mediates efficient pDC- and IFNα-dependent tumor rejection and survival benefit.
BALB/c or C57BL/6 mice were injected with tumor cells. When tumors reached sizes of 20–50 mm3 mice were treated i.v. with SC1 or with vehicle (saline) every 5 d. (a) Macroscopic spontaneous lung metastasis count in BALB/c mice (n = 7 per group) on d 24 after orthotopic 4T1 cell injection. Data representative of two independent experiments. (b) Tumor growth in BALB/c mice (n = 16/group) injected s.c. with CT26 cells. Pie charts show the proportion of mice displaying the indicated tumor stage at d 28 and 38 after CT26 inoculation. Tumor-free (TF), dead mice and mice bearing different size of tumors are indicated. (c) Survival of CT26-tumor-bearing mice. Data representative of more than three independent experiments. (d) Tumor growth in C57BL/6 mice (n = 10) injected s.c. with B16-OVA cells. Pie charts show the proportion of mice displaying the indicated tumor stage at d 14 and 24 after tumor inoculation. (e) Survival of C57BL/6 and Ifnar1−/- mice (n = 7–10) injected with B16-OVA cells. (f) Tumor growth in C57BL/6 WT (n = 8, left) and Bdca2-dtr mice (n = 6, center) injected s.c. with B16-OVA cells and i.p. with DT. IFNα levels in the sera of mice 1 h after the first i.v. injection with SC1 or vehicle (saline) was measured by ELISA (right). Data shown as mean ± s.e.m.of the indicated experimental numbers, p*<0.05, p**<0.01, p***<0.001, p****<0.0001 using Mann–Whitney test (A, B, D, and F, left) or one-way ANOVA-test (F, right) or Log-rank (Mantel-Cox) test (c,e).
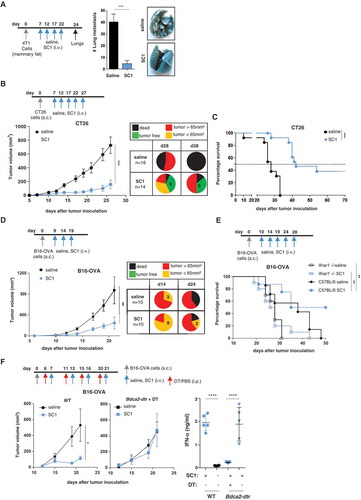
Figure 3. Intravenous administered SC1 is retained in the tumor environment and associated with activation of immune cells and Th1 polarization.
BALB/c mice were injected s.c. with CT26 cells. (a) After tumors reached sizes of 70–100 mm3, mice (n = 3–5/group) were i.v injected with single dose of SC1 or with vehicle (saline). Kinetics of SC1 quantification detected in liver (Li), spleen (Sp) and tumor (Tu) at 1 h and 24 h after injection were performed by LC-MS/MS. LLOQ: lower limit of quantification. Data representative of two independent experiments. B-E) After tumors reached sizes of 20–50 mm3, mice were treated i.v. with SC1 or with vehicle (saline) every 5 d. 24 h after treatment with fourth dose mice were sacrificed and tumors collected for flow cytometric analysis (B-D, data representative of two independent experiments) and for differential gene expression analysis (E). (b) Indicated leukocyte populations identified in CT26 tumors as a percentage of total CD45+ infiltrated cells (left). Suppressive index was calculated as the ratio of the frequencies of PMN-MDSC and CD8+ T cells (right). (c) Representative flow cytometry plots of the intratumoral pDC and CD86 expression. (d) Representative flow cytometry plots of TAM and level of expression of iNOS, CD206 and MHC class II. (e) mRNA expression levels of immuno-modulators in tumor samples from SC1 and vehicle (saline) treated mice. Data shown as mean ± s.e.m. of the indicated numbers of mice, p*<0.05, p**<0.01 using Mann–Whitney test (A-D) and unpaired t-test. (E).
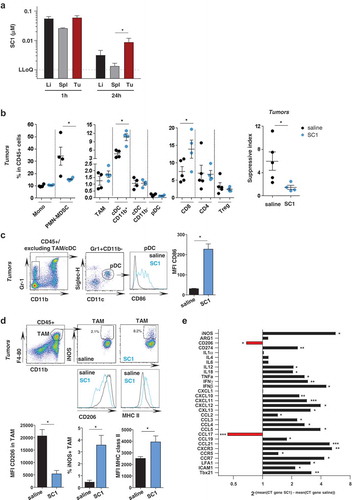
Figure 4. Antigen-specific CD8+ T cells are critical for SC1-mediated tumor control, and protection from tumor rechallenge.
(a-d) BALB/c mice were engrafted with CT26 cells and treated with four doses of SC1 or vehicle (saline) every 5 d. (a) The percentage of gp70-specific CD8+ T cells in blood (at d 21 after tumor inoculation, three independent experiments), spleens and tumors (on d 26, 2 independent experiments) was measured by tetramer staining by flow cytometry. (b) Lymphocytes were isolated from blood at d 21 (n = 5) (left) and from tumors at d 26 (n = 3) (right) and the number of IFNγ-producing cells was measured by ELISpot. (c) BALB/c mice (n = 10) were injected s.c. with CT26 cells, then treated with anti-CD8 antibody prior to each i.v. dose of SC1 or vehicle (saline). Tumor growth over time is shown. (d) Mice were treated as described in , and all SC1-treated, tumor-free mice (n = 4) were rechallenged s.c. with CT26 cells on d 77 after the first tumor injection. Control mice (n = 5). Tumor growth in mice is shown (left). The percentage of gp70-specific CD8+ T cells in the blood at d 90 after first CT26 tumor inoculation (d 13 after the CT26 tumor rechallenge) was measured by tetramer staining (right). Data shown as mean ± s.e.m, of the indicated numbers of mice. p*<0.05, p**<0.01, p***<0.001, using Mann–Whitney test (A, B, and D), one-way ANOVA-test (C).
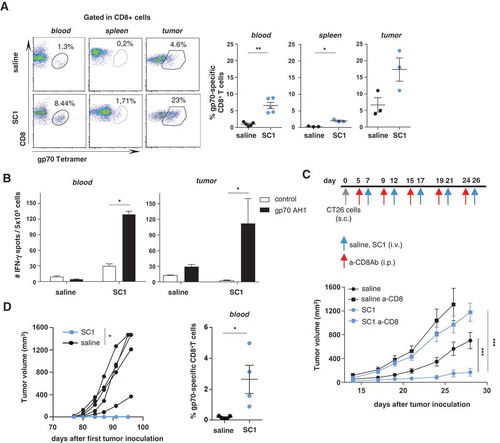
Table 1. Anti-mouse antibodies for flow cytometry.