Figures & data
Table 1. Top 15 of up- and down-regulated kinase activities according to Pepchip analysis in MUTZ-3 DC precursors treated with GM-CSF+IL-4+ TNFα.
Table 2. Top 15 of up- and down-regulated kinase activities according to Pepchip analysis in MUTZ-3 DC precursors treated with IL-10.
Figure 1. Cytokine exposure alters the kinome of MUTZ-3 DC precursors. (a) Representative details from developed PepChip kinomics arrays loaded with lysates from MUTZ-3 DC precursors exposed to plain medium (baseline kinase activity) or a DC differentiation-inducing cytokine cocktail consisting of GM-CSF, IL-4 and TNFα (GM4/TNFα). Each dot represents phosphorylation of a specific peptide substrate; increased or decreased phosphorylation levels upon cytokine exposure are clearly visible by eye: respective examples are demarcated by surrounding up- or downward oriented arrowheads. (b) Factors of down- or up-regulated phosphorylation levels of all altered peptide substrates (relative to medium exposed controls) on PepChip arrays loaded with lysates from MUTZ-3 DC precursors exposed to GM4/TNF-α or IL-10 (numbers of altered substrates out of 1024 total substrates are listed). (c) GSK3β network related kinase activities deduced from Pepchip analyses of cytokine-exposed MUTZ-3 DC precursors. STRING analysis of the PepChip upstream kinase data was performed to visualize differential kinase network activities. Fold-change of GM-CSF, IL-4 and TNF-α (GM4/TNF-α) or IL10, both vs. medium control: Red is “up” (fold-change stimulus vs control >1), Green is “down” (fold-change stimulus vs control <-1); color intensities reflect levels of up- or down-regulation. Double circles indicate p38α (MAPK14), JAK2, and GSK3β signaling nodes. (d) Western Blot performed on monocytes from two different donors exposed to GM4 or GM4/IL-10 with specific detection of total GSK3β, pS9-GSK3β (inactive GSK3β) and loading control Histone H3. Proteins and their molecular weights are indicated.
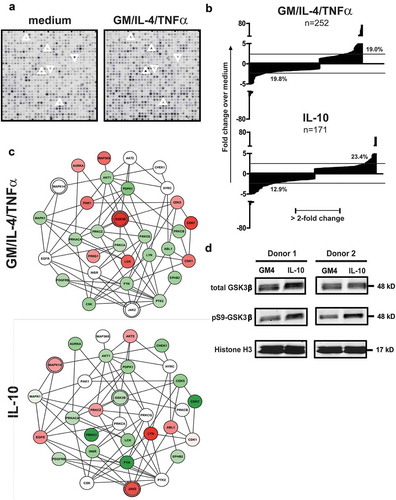
Figure 2. Inhibition of GSK3β hampers the differentiation of MUTZ-3 precursors and monocytes into DC. (a) Overview of the average percentages of CD14+ or CD1a+DC-SIGN+ cells in control MUTZ-DC and MUTZ-DC differentiated in the presence of the GSK3β inhibitor SB 415286 (n = 4), mean ±SD are shown. (b) Overview of the average percentages of CD14+ or CD1a+ cells in control MoDC, MoDC differentiated in the presence of the GSK3β inhibitor, MoDC differentiated with IL-10 or MoDC differentiated with IL-10 plus GSK3β inhibitor (n = 3), mean ±SEM are shown. (c) FACS histograms for the markers CD40, CD16 and BDCA3 on MoDC differentiated in the presence or absence of GSK3β inhibitor. The number listed in the graphs are the mean fluorescence intensities. Results are representative of three different experiments. (d) Secretion of relative IL-12p70 and IL-10 levels by DC treated with or without the GSK3β inhibitor; absolute average IL-12p70 and IL-10 levels in the control MoDC cultures are listed. Shown are mean ± SD from 5 experiments. (e) Overview of the average % of proliferated T cells (CD3+) induced by MoDC cultured in the absence or presence of the GSK3β inhibitor determined by allogeneic MLR. Day-6 results shown are from 3 experiments (n = 3); ratio peripheral blood lymphocytes to DC was 10:1. Significance shown as * = P < .05, ** = P < .01 and *** P < .001.
Figure 3. Enforced expression of constitutively active GSK3β renders DC differentiation and maturation refractory to IL-10-mediated suppression. (a) Western Blot analysis performed on monocytes from two different donors differentiated in the presence of GM4/Ad-LUC, GM4/IL-10/Ad-LUC or GM4/IL-10/AdCA.GSK3β with specific detection of total GSK3β, pS9-GSK3β (inactive GSK3β) and loading control Histone H3. Protein names and molecular weight are indicated. (b) Averaged intensity of Western Blot bands, measured with ImageJ, from four independent analyses, for pS9-GSK3β/total GSK3β from monocytes differentiated with GM4/Ad-LUC, GM4/IL-10/Ad-LUC or GM4/IL-10/AdCA.GSK3β. (c) Images of the corresponding monocyte culture conditions were obtained at day 6 by IncuCyte. (d) Overview of the average CD14, CD86, and CD83 geometric mean intensity in MoDC differentiated with GM4/Ad-LUC, GM4/IL-10/Ad-LUC or GM4/IL-10/Ad-CA.GSK3β (n = 4), white bars: unstimulated MoDC, black bars: mDC after CD40L+INFγ stimulation. Mean ±SEM are shown. (e) Average IL-10 and IL-6 (pg/mL) release by MoDC differentiated with GM4/Ad-LUC, GM4/IL-10/Ad-LUC or GM4/IL-10/Ad-CA.GSK3β (n = 4) after CD40L+ INFγ stimulation. Mean ±SEM are shown, significance shown as * = P < .05, ** = P < .01 and *** P < .001.
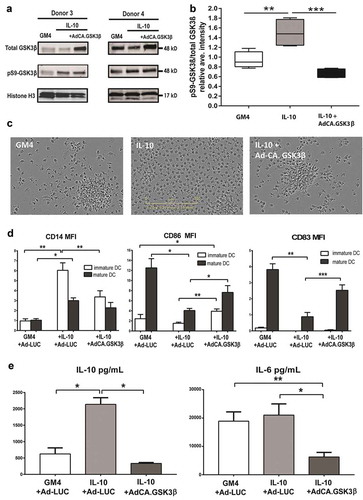
Figure 4. Constitutively active GSK3β renders MoDC resistant to the suppressive effects of IL-10 during maturation. (a) Representative FACS dot plots showing the expression of CD14 and HA-tagged GSK3β in un-transduced MoDC and adenovirally transduced MoDC (Ad-CA.GSK3β) matured (by a cocktail of IL-6, PGE2, IL-1β, and TNFα) in the absence or presence of IL-10. Percentages of CD14+ cells are indicated; NB: in the two lower dot plots percentages CD14+ cells of transduced MoDC (i.e. HA+) are listed. (b) Expression of CD1a (black bars) and CD14 (white bars) on MoDC, matured in the absence or presence of IL-10, the latter also for transduced MoDC (Ad-CA.GSK3β or Ad-LUC), expressing constitutively active GSK3β. Shown are means ±SD from 4 experiments. (c) Overview of the relative percentages of cells expressing CD14 in control MoDC (set at 100%) and IL-10 exposed MoDC, un-transduced or transduced by Ad-CA.GSK3β. Shown are means ±SD from 4 experiment. Significance shown as * = P < .05, ** = P < .01 and *** P < .001.
Figure 5. Constitutively active GSK3β renders MoDC differentiation refractory to the suppressive effects of melanoma-derived soluble factors. Phenotype, cytokine release and allogeneic T cell priming capacities are shown of MoDC differentiated in the presence of supernatants derived from the indicated melanoma cell lines and transduced with Ad-LUC or Ad-CA.GSK3β. (a) Percentages of CD1a and CD80 positive cells and (b) percentages of CD14 and BDCA3 positive cells; Ad-LUC (gray boxes) or Ad-CA.GSK3β (black boxes). Shown are boxplots with whiskers from 4 different experiments. (c) IL12-p70/IL-10 release ratios; Ad-LUC (gray circles), Ad-CA.GSK3β (black squares), n = 4. (d) Percentages of proliferated CD4+ and CD8+ allogeneic T cells; Ad-LUC (gray circles) or Ad-CA.GSK3β (black squares). Day-6 results of an MLR are shown (n = 4); ratio peripheral blood lymphocytes to DC was 10:1. (e) INF-γ/IL-10 release ratios by the T cells from the MLR assay; Ad-LUC (gray circles), Ad-CA.GSK3β (black squares), n = 4. Significance shown as * = P < .05, ** = P < .01 and *** P < .001.
Figure 6. Constitutively active GSK3β improves tumor immune surveillance in vivo. Anti-tumor efficacy and phenotypic analysis of the immune infiltrates at the tumor site 10 days after the different treatments started. (a) 4 mice per group received subcutaneous engraftment of B16.OVA tumor cells that were grown until a tumor diameter of 3mm was reached. Then 108 viral particles of non-replicating adenoviruses (coding for LUC or CA.GSK3β) or PBS were injected intratumorally at day 0, 1, 3, 6 and 9. Mice were sacrificed at day 10 and tumors were collected and processed. (b) Shows the fold increase of tumor volume defined as: (length-day10 * (width-day10)2 * 0.5)/(length-day0 * (width-day0)2 * 0.5)*100 in the different treatment groups. (c) Representative FACS histograms of the MHC-II geometric mean intensity in the CD11c+B220− conventional DC (cDC) populations in mice from different treatment groups. (d) Scatter plot of the percentage of MHC-II+CD86+ cDC. (e) Scatter plot of the percentages of CD8α+ cross-presenting cDC1s. (f) Scatter plot of the percentages of CD3+CD8+ T cells of total cells. (g) Correlation graph between the percentages of CD8α+ cDC1 (of cDC) and CD8+ T cells (of T cells) showing the 95% confidence bands of the best-fit line. Pearson r = 0.7705. (h) Correlation graph between the tumor volume fold increase and the total percentage of CD8+ T cells (of total cells) showing the 95% confidence bands of the best-fit line. Pearson r = −0.6634. The different treatment groups are shown as PBS (black triangles), Ad-LUC (black squares) and Ad-CA.GSK3β (black circles). 1-way unpaired ANOVA was applied. Shown are means ±SEM. Significance shown as * = P < .05, and ** = P < .01.