
Figures & data
Table 1. Clinicopathologic characteristics of the anti-PD-1 monotherapy cohort
Table 2. Clinicopathologic characteristics of the combination anti-PD-1 and anti-CTLA-4 immunotherapy cohort
Figure 1. Spatial profiling of responders and non-responders treated with anti-PD-1 monotherapy. (a) Representative multiplex immunofluorescent images of intratumoral and peritumoral regions stained with CD8, FOXP3, PD-1, PD-L1, SOX10 and DAPI, from a responder and non-responder to anti-PD-1 alone. (b) Scatter plots illustrating the number of CD8+ immune cells within proximity to a melanoma cell at 20 µM intervals, in a single representative image from a responding and non-responding patient. (c) Bar graphs showing the differences in the number of intratumoral and peritumoral CD8+ cells within proximity to a SOX10+ melanoma cell between responders and non-responders at 20 µM intervals. (d) Box plots comparing the number of immune cells within 20 µM of a SOX10+ tumor cell in responders and non-responders. Error bars represent SD
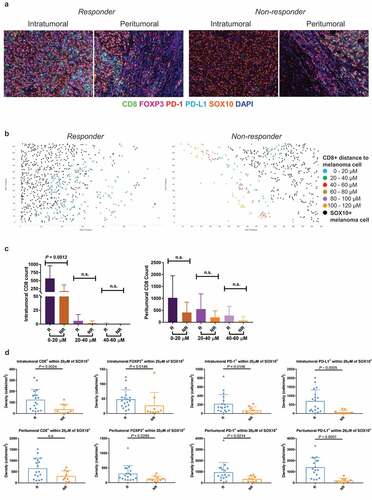
Figure 2. Spatial profiling of responders and non-responders treated with combination therapy. (a) Representative multiplex immunofluorescent images of intratumoral and peritumoral regions stained with CD8, FOXP3, PD-1, PD-L1, SOX10 and DAPI, from a responder and non-responder to combination anti-PD-1 and anti-CTLA-4 immunotherapy. (b) Scatter plots illustrating the number of CD8+ immune cells within proximity to a melanoma cell at 20 µM intervals, in a single representative image from a responding and non-responding patient. (c) Bar graphs showing the differences in the number of intratumoral and peritumoral CD8+ cells within proximity to a SOX10+ melanoma cell between responders and non-responders at 20 µM intervals. (d) Box plots comparing the number of immune cells within 20 µM of a SOX10+ tumor cell in responders and non-responders. Error bars represent SD
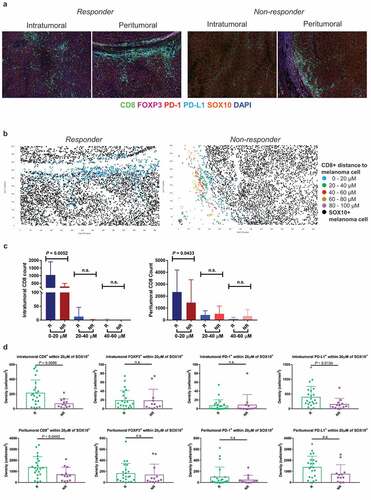
Table 3. Univariate and multivariate Cox regression analysis for progression-free survival in anti-PD-1 monotherapy
Figure 3. Spatial distribution of immune cells correlates with progression-free survival in anti-PD-1 based therapies. (a) Kaplan–Meier curves demonstrating significantly longer progression-free survival in anti-PD-1 monotherapy treated patients with numbers of immune cells within 20 µM of a melanoma cell that are above the cutoff. (b) Kaplan–Meier curves demonstrating significantly longer progression-free survival in combination-treated patients with numbers of immune cells within 20 µM of a melanoma cell that are above the cutoff. (c) ROC curves demonstrating the area under the curve for the final regression model for 12 months progression-free survival with anti-PD-1 monotherapy, including factors remaining significant following multivariate analysis (d) ROC curves demonstrating the area under the curve for the final regression model for 12 months progression-free survival with combination therapy, including factors remaining significant following multivariate analysis
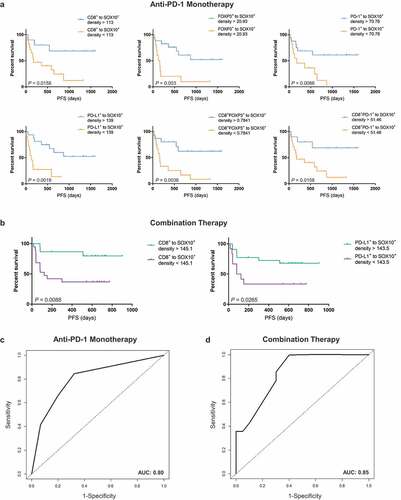
Table 4. Univariate and multivariate Cox regression analysis for progression-free survival in combination therapy