
Figures & data
Figure 1. Lentiviral transduction of primary canine T cells
PBMCs from four healthy dogs were bead-stimulated and infected the next day with equal amount of lentivirus expressing GFP under the control of CMV or EF-1α promoters in parallel. (a) Day 6 post-stimulation, live lymphocytes were analyzed by flow cytometry (b) frequency of GFP+ cells, mean and SEM displayed; comparison performed using a paired two-tailed t test, **, p ≤ 0.01. Enriched PBLs from three healthy dogs were stimulated with aAPCs, agonistic anti-canine CD3, and rhIL-2 and rhIL-21. (c) Frequency of CD25low and CD25high expressers among live CD5+ cells measured by flow cytometry, mean and SEM displayed. (d) aAPCs were enumerated by measuring live hCD45+ cells by flow cytometry, normalizing to counting beads and comparing this number to the initial number added to culture, mean and SEM displayed.
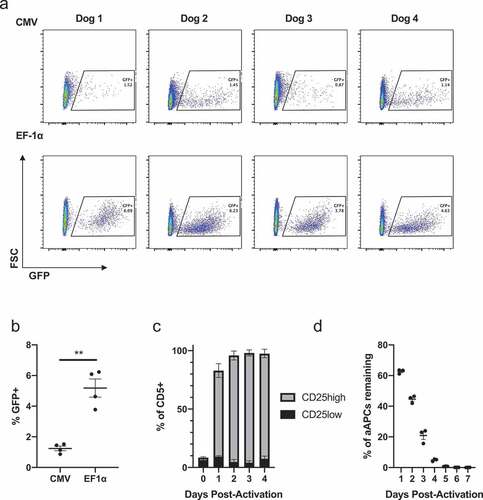
Figure 2. Design, manufacture and function of cCD20-28-ζcanine CAR T cells
(a) Diagram of cCD20-28-ζ construct. (b) CAR surface expression among live CD5+ cells at day 14 post-transduction with pELxPS cCD20-28-ζ lentivirus. (c) Lysis of irradiated GL1 (cCD20-) cells and CLBL-1 (cCD20+) cells after overnight co-culture with 1:1 or 5:1 T cell: target cells, mean and SD of triplicate wells displayed. (d) CAR surface expression among live CD5+ cells at baseline and 7 days after first stimulation and 9 days after second stimulation with irradiated CLBL-1 cells at a 1:1 T cell: CLBL-1. (e) CAR T cell counts at baseline and 7 days after first stimulation and 9 days after second stimulation with irradiated CLBL-1 cells at a 1:1 T cell: CLBL-1.
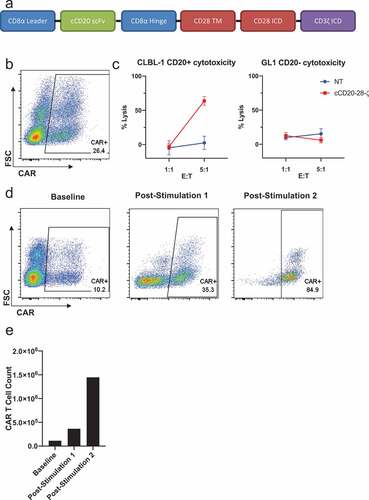
Table 1. cCD20-28-ζ: clinical parameters and CAR T cell characteristics
Figure 3. Treatment of patient 429–003 with cCD20-28-ζCAR T cells
(a) Surface expression of the CAR on live CD5+ cells at the end of initial culture. (b) CD4 and CD8 expression on live CD5+ T cells at end of initial culture. (c) Absolute numbers of CD79a+ and CD5+ cells over time relative to infusion, calculated from flow cytometry and automated complete blood counts (d) Frequency of CD79a+ and CD5+ cells among live cells in the right popliteal lymph node over time following infusion. (e) CD79a and cCD20 expression among live cells within the right popliteal lymph node over time following infusion. (f) Copies of integrated CAR gene per μg of PBMC genomic DNA over time relative to infusion, as measured by qPCR. (g) Serum CAMA concentration over time measured by ELISA with mean and SD of well triplicates displayed (lower limit of detection 7.8ng/mL).
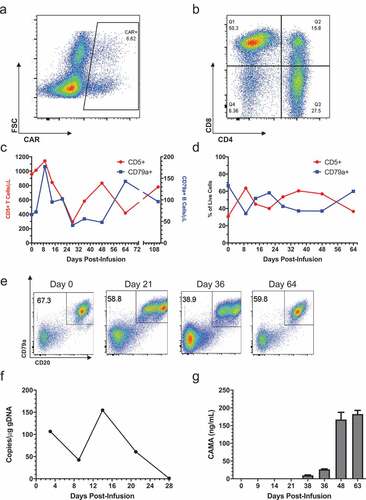
Figure 4. Design and expansion of cCD20-BB-ζ canine CAR T cells
(a) Diagram of cCD20-BB-ζ construct. (b) CAR surface expression on live CD5+ cells before and 7 days after sequential stimulations with irradiated CLBL-1 cells at 1:1. (c) CAR T cell counts at baseline and 7 days after stimulations 1 and 3 and 9 days after stimulation 2. (d) Specific lysis of distinctly labeled GL1-GFP-CD20 cells using GL1-GFP cells as controls after 4 hour co-culture with 5:1, 1:1 or 1:5 T cell: target cells 19 days after transduction, mean and SD of triplicate wells displayed. (e) Canine interferon γ secretion quantified using ELISA following 24-hour co-culture of 1:1 T cell: target cells 20 days after transduction, mean and SD of triplicate wells displayed.
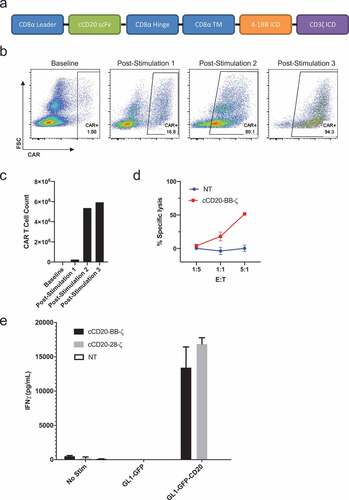
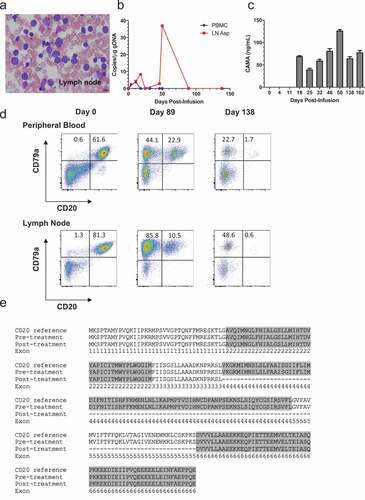
Figure 5. Treatment of patient 429–006 with cCD20-BB-ζ CAR T cells
(a) Cytological specimen from the target malignant lymph node, Wright-Giemsa stain, magnification x100. (b) Copies of integrated CAR gene per μg of PBMC genomic DNA over time relative to infusion, as measured by qPCR. (c) Serum CAMA concentration over time measured by ELISA with mean and SD of well triplicates displayed (lower limit of detection 3.9ng/mL). (d) CD79a and CD20 surface expression among live cells in the patient’s peripheral blood and lymph node over time. (e) Annotated reference canine CD20 sequence (NCBI accession number: XP_005633357) aligned with the CD20 sequences from the patient’s neoplastic B cells pre- and day 162 post-CAR treatment.
Supplemental material