2,271
Views
19
CrossRef citations to date
0
Altmetric
Back Matter

Establishment and validation of an immunodiagnostic model for prediction of breast cancer

ORCID Icon, , , , , ORCID Icon, , , ORCID Icon & show all
Article: 1682382 | Received 06 Aug 2019, Accepted 14 Oct 2019, Published online: 28 Oct 2019

Figures & data

Table 1. Characteristics of study participants

Figure 1. Study design. BC, breast cancer; NHC, normal human controls; BBD, benign breast disease; ELISA, enzyme-linked immunosorbent assay

Figure 1. Study design. BC, breast cancer; NHC, normal human controls; BBD, benign breast disease; ELISA, enzyme-linked immunosorbent assay

Figure 2. Profiles of autoantibodies against 11 tumor-associated antigens tested by western blotting in 10 patients with breast cancer (B1-B10) and 10 normal controls (C1-C10)

Figure 2. Profiles of autoantibodies against 11 tumor-associated antigens tested by western blotting in 10 patients with breast cancer (B1-B10) and 10 normal controls (C1-C10)

Table 2. Serum relative concentration levels of individual autoantibody among breast cancer patients, breast benign disease and normal individual

Figure 3. Scatter plots of sera relative concentration levels of individual autoantibody among breast cancer patients (NTC = 184, NVC = 197), benign breast disease (NTC = 200, NVC = 109) and normal individual (NTC = 184, NVC = 109) in two cohorts (TC, training cohort; VC, validation cohort). BC, breast cancer; NHC, normal human controls; BBD, benign breast disease

*: P < .05, **: P < .01, ***: P < .001 (Kruskal–Wallis H test, Mann–Whitney U test).
Figure 3. Scatter plots of sera relative concentration levels of individual autoantibody among breast cancer patients (NTC = 184, NVC = 197), benign breast disease (NTC = 200, NVC = 109) and normal individual (NTC = 184, NVC = 109) in two cohorts (TC, training cohort; VC, validation cohort). BC, breast cancer; NHC, normal human controls; BBD, benign breast disease

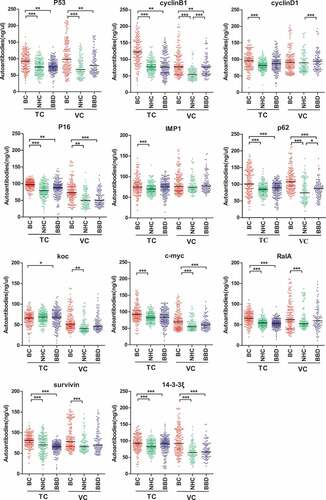
Table 3. LOOCV results predicted by the two models of BC

Figure 4. Performance of the prediction model with five anti-TAAs autoantibodies to detect breast cancer. Receiver operating characteristic (ROC) curves from training cohort (a, b) and validation cohort (c, d). Performance shown for distinguishing individuals with BC from NHC (a, c) or BBD controls (b, d). TC, training cohort; VC, validation cohort; BC, breast cancer; NHC, normal human controls; BBD, benign breast disease; Se, sensitivity; Sp, specificity

Figure 4. Performance of the prediction model with five anti-TAAs autoantibodies to detect breast cancer. Receiver operating characteristic (ROC) curves from training cohort (a, b) and validation cohort (c, d). Performance shown for distinguishing individuals with BC from NHC (a, c) or BBD controls (b, d). TC, training cohort; VC, validation cohort; BC, breast cancer; NHC, normal human controls; BBD, benign breast disease; Se, sensitivity; Sp, specificity

Table 4. Diagnostic value of the prediction model with five anti-TAAs autoantibodies for different stages and ages of BC patients

Figure 5. Positive rates of autoantibodies against eight TAAs or combined five TAAs in individual sera of BC patients, BBD patients and NHC (a, b). The cutoff value was set at the maximum Yoden index when the specificity was greater than 95%. Positive rates of the prediction model with five anti-TAAs autoantibodies among subgroups of BC patients based on tumor stage (c-f), molecular subtypes (g), lymph node metastasis (h), histological type (i) and family history of tumor (j). TC, training cohort; VC, validation cohort; BC, breast cancer; NHC, normal human controls; BBD, benign breast disease

*: P < .05, **: P < .01, ***: P < .001 (Chi-square tests).
Figure 5. Positive rates of autoantibodies against eight TAAs or combined five TAAs in individual sera of BC patients, BBD patients and NHC (a, b). The cutoff value was set at the maximum Yoden index when the specificity was greater than 95%. Positive rates of the prediction model with five anti-TAAs autoantibodies among subgroups of BC patients based on tumor stage (c-f), molecular subtypes (g), lymph node metastasis (h), histological type (i) and family history of tumor (j). TC, training cohort; VC, validation cohort; BC, breast cancer; NHC, normal human controls; BBD, benign breast disease

Table 5. Positive reactivity of the prediction model with five anti-TAAs autoantibodies among subgroups

Supplemental material

Supplemental Material

Download ()