Figures & data
Figure 1. Design and functionality of novel GD2-CAR-T. a) Schematic illustration of GD2-CAR constructs in heavy chain/light chain (HL) and light chain/heavy chain (LH) configuration. b) Schematic illustration of GD2-CAR and EGFRt expression on the plasma membrane. In c), GD2-CAR expression was determined by flow cytometry against EGFRt, coexpressed with the GD2-CAR. Representative plots for non-transduced T cells (left), GD2-CAR-T LH (middle) and GD2-CAR-T HL (right) transduced T cells (middle) are shown. In d), GD2-CAR-T were incubated with GD2+ neuroblastoma cell line LS at an E:T ratio of 2:1 for 12 h. Target-cell lysis was determined by impedance-based real-time cytotoxicity assay xCELLigence® RTCA. Data shown represent mean of two independent experiments in triplicates
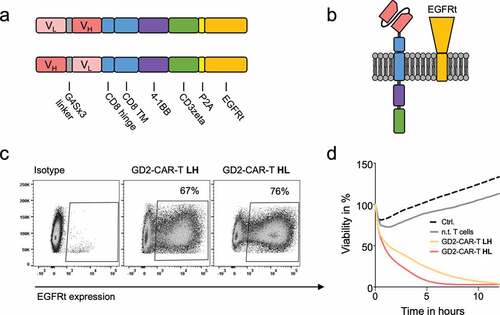
Figure 2. GD2 expression on breast cancer cell lines. GD2 expression on indicated breast cancer cell lines was determined by flow cytometry using an APC-labeled GD2 mAb. In a), representative histograms of three individual analyses are shown. GD2 positivity was calculated by Overton subtraction of histograms, sample data minus corresponding isotype control. In b), representative plots SSC vs. GD2 expression of three individual analyses are shown to illustrate GD2 expression in a subpopulation of cells in the cell lines T-47D and MDA-MB-231
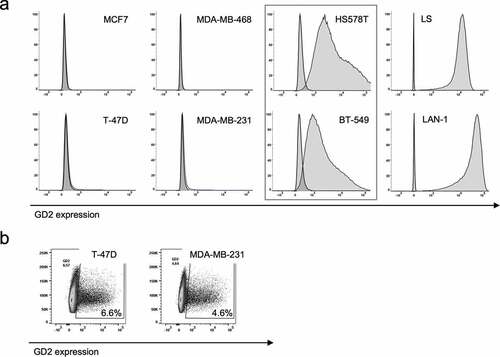
Figure 3. Specific lysis of breast cancer cell lines by GD2-CAR-T. GD2-CAR-T (red) or CD19-CAR-T (blue) were incubated with indicated breast cancer cell lines at an E:T ratio of 2:1 for 48 h. Target cell lysis was determined by impedance-based real-time cytotoxicity assay xCELLigence® RTCA. Kinetics over 48 h are demonstrated. Data shown represent mean ± SD of three independent experiments in triplicates
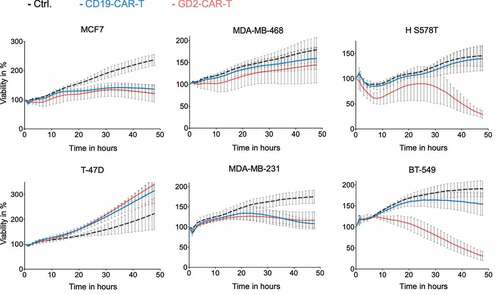
Figure 4. GD2-CAR-T cells arrest tumor growth in vivo. NSG mice were injected into the fourth mammary fat pad with 5 × 10⁶ MDA-MB-231 cells, stably expressing luciferase on day 0. On day +7, tumor-bearing mice were treated with either PBS, 5 × 10⁶ CD19-CAR-T or 5 × 10⁶ GD2-CAR-T. Mice were sacrificed on day +21. In a), noninvasive BLI images of luciferase activity at day +21 are shown for tumor burden assessment (left panel, n = 4). Resected tumors of the corresponding mice are shown in the right panel. In b), BLI signals above a 10% threshold were quantified as average radiance [photons/second/cm2/sr]. Timepoints day +7, injection of CAR-T, day +14 and day +21, end of the experiment, are shown. (Of note, for day +7 values were set 0 as no signals above a 10% threshold could be calculated. Corresponding optical imagines are given in Suppl. Figure 4a). In c), tumor growth kinetics are demonstrated as determined by caliper measurement. Data shown represent mean ± SD of 4 mice each group. (** = p < .001)
![Figure 4. GD2-CAR-T cells arrest tumor growth in vivo. NSG mice were injected into the fourth mammary fat pad with 5 × 10⁶ MDA-MB-231 cells, stably expressing luciferase on day 0. On day +7, tumor-bearing mice were treated with either PBS, 5 × 10⁶ CD19-CAR-T or 5 × 10⁶ GD2-CAR-T. Mice were sacrificed on day +21. In a), noninvasive BLI images of luciferase activity at day +21 are shown for tumor burden assessment (left panel, n = 4). Resected tumors of the corresponding mice are shown in the right panel. In b), BLI signals above a 10% threshold were quantified as average radiance [photons/second/cm2/sr]. Timepoints day +7, injection of CAR-T, day +14 and day +21, end of the experiment, are shown. (Of note, for day +7 values were set 0 as no signals above a 10% threshold could be calculated. Corresponding optical imagines are given in Suppl. Figure 4a). In c), tumor growth kinetics are demonstrated as determined by caliper measurement. Data shown represent mean ± SD of 4 mice each group. (** = p < .001)](/cms/asset/9a7c6076-96be-415f-bea6-e2a33c00ea29/koni_a_1683345_f0004_oc.jpg)
Figure 5. GD2-CAR-T cells prevent metastasis formation in vivo. Lungs of NSG mice injected with 5 × 10⁶ MDA-MB-231 cells into the fourth mammary fat pad on day 0, treated on day +7 with either 5 × 10⁶ CD19-CAR-T or 5 × 10⁶ GD2-CAR-T and sacrificed on day +21 were fixed and stained with the pan-cytokeratin staining AE1/3 to determine metastatic infiltration. In a), the presence of AE1/3 positive cells in the lungs of mice was quantified, 4 mice each group. In b), representative images for both groups are shown, demonstrating the presence and absence of metastatic cells
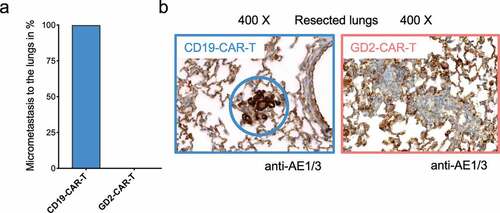
Figure 6. GD2-CAR-T specifically expand and infiltrate in tumor and metastatic tissue. NSG mice were injected with 5 × 10⁶ MDA-MB-231 cells into the fourth mammary fat pad on day 0, treated on day +7 with either 5 × 10⁶ CD19-CAR-T or 5 × 10⁶ GD2-CAR-T and sacrificed on day +21. In a), blood was taken on day +21 and analyzed for the presence of CAR-T by flow cytometry. CAR-T were identified being negative for mCD45 and positive for hEGFRt expression. Data shown represent mean ± SD of 4 mice each group. In b) and c), GD2-CAR-T were further analyzed for the activation marker CD25 and the exhaustion markers PD-1, TIM-3 and LAG-3 by flow cytometry. In c), expression of single and multiple exhaustion markers at the same time is demonstrated. Data shown in b) and c) represent mean of 4 mice in the GD2-CAR-T treated group. In d), primary tumors and lungs of mice were fixed after scarification on day +21 and stained with a hCD3 antibody to identify infiltrateing CAR-T. Representative images for 4 mice each group at different magnification are shown, demonstrating the absence or presence of infiltrating CAR-T. (** = p < .001)
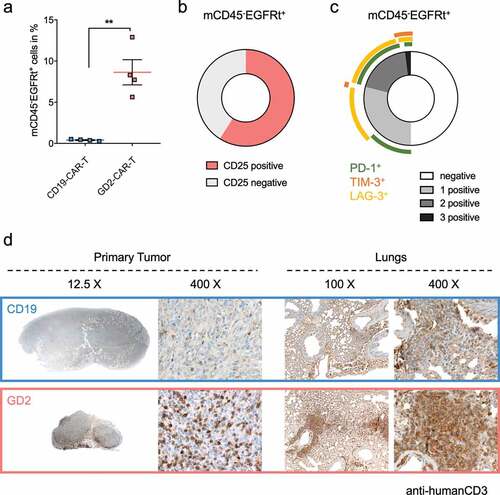
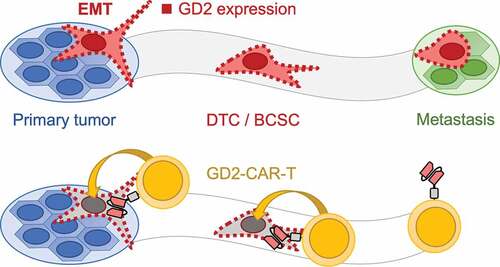
Figure 7. Schematic illustration of the mechanism how GD2-CAR-T prevent metastasis formation. Metastasis formation is a process in which tumor cells dissociate from the primary tumor after undergoing EMT. These DTCs or BCSCs disseminate throughout the body and finally form distant metastasis. GD2 expression, indicated by red squares, is associated with EMT and the acquisition of a BCSC phenotype (upper panel). Targeting GD2 on BCSCs by GD2-CAR-T leads to the elimination of BCSCs and prevents metastasis formation (lower panel)