Figures & data
Figure 1. B7-H3 expression on human tumors. (a) Cell-surface expression of B7-H3 on cell lines and in solid human tumors from patient tissue. Flow cytometry analyses using 7E12-mAb were performed to detect cell-surface B7-H3 on numerous human tumor cell lines, including melanoma (624Mel), lung cancer (PG, A549), liver cancer (Huh7, HepG2), breast cancer (MDA-MB-231), ovarian cancer (SKOV3), cervical cancer (HeLa), squamous carcinoma (SCC-47), and colon cancer (HT-29, SW620). HLB100, a human epithelial cell line which is tumorigenic in nude mice. Gray area: isotype; Dotted line: B7-H3. (b) The microarray tumor and normal tissue slides (US Biomax or Zhuoli Biotech) were analyzed by IHC using anti-B7-H3 mAb (clone 6A1, Abcam). Representative immunohistochemical staining of B7-H3 expression in the normal tissues verse tumor tissues from a variety of solid human tumors including colon cancer, gastric carcinoma, ovarian cancer, breast cancer, lung cancer, endometriasl cancer, melanoma and prostate cancer. Images were taken under x400 magnification
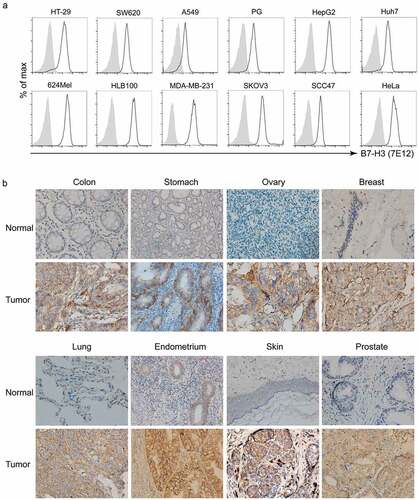
Figure 2. The function of B7-H3 specific CAR-T cells. (a) Schematic structure of the B7-H3 targeted CARs. H3 CAR consisting of anti-B7-H3 scFv and following the CD8 hinge and transmembrane domain, 4-1BB intracellular domain and the CD3ζ intracellular domain. A control CAR was designed by replacing CD3ζ domain in the H3 CAR with a truncated form of CD3ζ. VH: variable heavy chain; VL: variable light chain; L: linker; T2A: 2A oligopeptides of Thosea asigna virus. (b) Expression of B7-H3-specific CAR or EGFP on human T cells was detected by flow cytometry using hB7-H3-mFc protein (black line); Flag-mFc protein served as an isotype control (gray). (c) Cytotoxicity of CAR-T cells was evaluated by incubating CAR-T cells with FarRed-labeled PG cells at different effector/target (E/T) ratios ranging from 1:1 to 15:1 for 12 h. The cells were stained with DAPI and the viability of the PG cells was analyzed by Flow cytometer. Cytotoxicity was then calculated as described in Materials and methods. (d) PG tumors were subcutaneously established in the right flanks of NCG mice. Control or H3 CAR-T cells were i.v. injected to treat the mice at day 5, 10, and 15 (red arrows). The mean tumor diameters in each group (n = 5) are shown. Error bars denote SD. P values by a two-way ANOVA. ***(P < .001). (e) IFN-gamma levels in the serum of the mice were measured by ELISA at day 15 after last treatment. All data are presented as mean ± standard deviation, and error bars denote SD (c-e). P values by a two-way ANOVA (d) or a two-tailed unpaired t-test (e). ***(P < .001). (f) Representative IHC staining using anti-B7-H3 mAb (clone 6A1, Abcam) for B7-H3 protein on the tumor tissues remained in the mice treated with H3 CAR-T cells
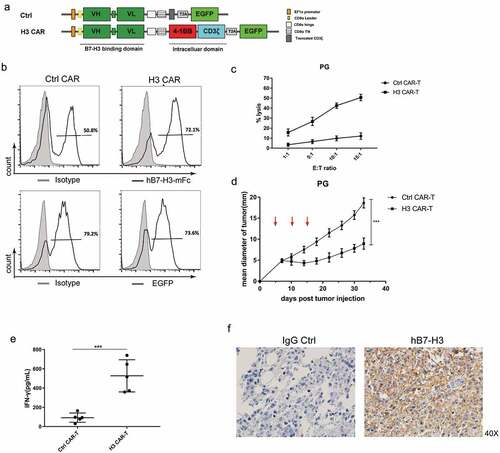
Figure 3. Antitumor activity of B7-H3 targeted CAR-T cells coexpressing PD-1 chimeric receptors in vitro. (a) Schematic representation of H3/DS CAR, H3/PD28 CAR and H3/PDmut7R CAR constructs. PD28: extracellular PD-1 fused with CD28 domains; PDmut7R: extracellular PD-1 fused with IL-7R domains. (b) CAR-T cells were co-incubated with the FarRed labeled tumor cells at different effector: target (E:T) ratios ranging from 1:1 to 15:1 for 12 h. Cells were stained with DAPI and the viability of tumor cells was analyzed via Flow cytometer. Cytotoxicity was then calculated as described in Materials and Methods. The data are presented as mean ± standard deviation of triplicates. (c). B7-H1 expression on MDA-MB-231-H3KO cell line were validated by flow cytometry analysis. (d) The ability of CAR-T cells to release cytokines upon antigen recognition was evaluated in vitro. CAR-T cells (1 × 10⁶) were co-incubated with 5 × 10⁵ irradiated B7-H3 positive or negative tumor cells. Supernatants were collected after 24 h and analyzed for cytokines using a cytometric bead array. The data are presented as mean ± standard deviation of triplicates. Error bars denote SD. P values by a two-tailed unpaired t-test. * (P < .05), **(P < .01), ***(P < .001) and **** (P < .0001); ns, not significant
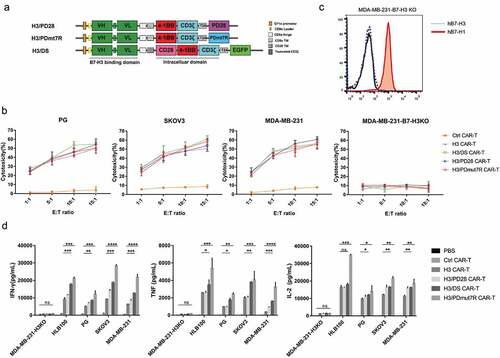
Figure 4. The antitumor activity of B7-H3 targeted CAR-T cells co-expressing PD-1 chimeric receptors in vivo. (a) PG tumors were s.c. established in the right flank of NCG mice and randomly grouped (n = 5 per group). When tumors reached a diameter of approximately 3–4 mm, mice were treated with three intravenous injections of 5 × 10⁶ CAR-T cells on day 5, 10 and 15 (red arrows). (b) SKOV3 tumors were s.c. established in the right flank of NCG mice and randomly grouped (n = 5 per group). When the tumors reached a mean diameter of approximately 3–4 mm, mice were treated with three intravenous injections of 5 × 10⁶ CAR-T cells on day 12, 20 and 29 (red arrows). (c) The quantity of persistently circulating CD4+ and CD8+ T cells from mice bearing PG tumors 1 week after being treated with the indicated T cells. (d) Serum cytokine productions from mice bearing PG tumors treated with the indicated T cells were analyzed by a cytometric bead array. (e) BLI illustrating tumor growth in PG-luc metastatic mouse model. NCG mice were intravenously injected with 105 Firefly-luciferase expressing PG cells and randomly grouped (n = 4 per group). Then mice were treated with three intravenous injections of 5 × 10⁶ CAR-T Cells. Tumor growth was assessed by BLI weekly. (f) BLI kinetics of tumor growth were calculated using Living Image software. (g) The Kaplan Meier survival analysis of PG i.v. challenged mice treated with the indicated T cells (n = 8 per group). Error bars denote SD. P values by a two-way ANOVA (a, b, f); Unpaired and non-parametric Mann-Whitney test with two-tailed P value calculation (c); P values by a two-tailed unpaired t-test (d); P values by a log-rank (Mantel-Cox) test (g). * (P < .05), **(P < .01), ***(P < .001) and **** (P < .0001); ns, not significant
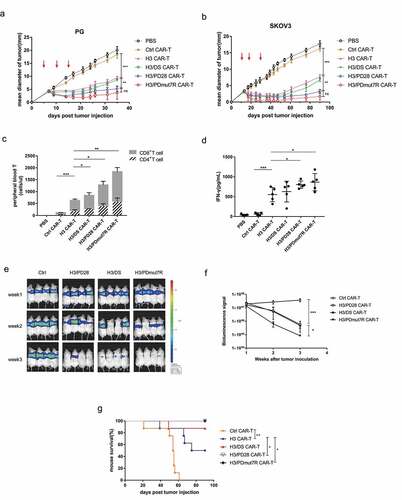
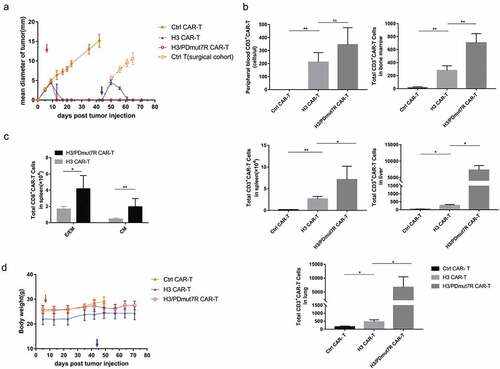
Figure 5. H3/PDmut7R CAR-T cells are prone to promoting anti-tumor persistence in a re-challenge tumor model. (a) NCG mice were inoculated subcutaneously with 5 × 10⁵ PG-B7-H3 cells. When the tumors reached a diameter of approximately 3–4 mm, mice were randomly grouped (n = 5 per group) and intravenously treated with different groups of CAR-T cells, 2 × 10⁶ per mouse, on day 7 (red arrow). At day 30, tumors in the control CAR-T cell treated group were surgically excised. At day 44, all mice were re-challenged with 2.5 × 10⁶ tumor cells (blue arrow). Tumor growth was monitored by measuring tumor size. (b) The number of CD3+ CAR-T cells in peripheral blood, spleen, liver, lung and BM were determined by flow cytometry at day 71, the end of experiments. (c) The phenotypes of the CAR-T cells obtained from the spleen were analyzed by flow cytometry at day 71. Effector/effector memory (E/EM; CD44+ CD62L-) and central memory (CM; CD44+ CD62L+) subsets of CD8+ CAR-T cells were counted. (d) Mouse body weight was measured once a week. Error bars denote SD. Data were analyzed by an unpaired and non-parametric Mann-Whitney test with two-tailed P value calculation (b, c). * (P < .05), **(P < .01), ***(P < .001) and **** (P < .0001); ns, not significant