Figures & data
Figure 1. Screening of immune responses against a panel of predicted neo-antigen candidates reveals oligoreactivity. a. Representative ELISPOT wells showing IFNγ production in response to HA; UQCRC2 wild type (WT) and mutant (MUT) peptides; WT and MUT neo-antigen peptide pools. b. Dot plot summarizing responses against individual peptides, and peptide pools in AB1 murine mesothelioma bearing mice. Group A: 17 peptides, Group B: 16 peptides. (n = 8–16, 3 separate experiments). c.Responses against peptide pools of 5–6 neo-antigen candidates in Line1 Alveolar lung carcinoma bearing mice (n = 4). d. Responses against peptides of neo-antigen candidates in AE17 murine mesothelioma bearing mice (n = 5). Each dot represents mean dLN responses from an individual animal. Error bars show mean ± SD. Paired Student’s T-test
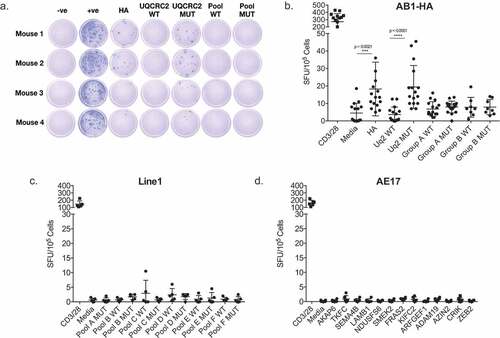
Figure 2. Neo-antigen specific responses vary stochastically between otherwise identical animals. a. IFNγ production in response to HA, UQCRC2 peptides and CD3/28 stimulation (n = 52). Each dot represents mean IFNγ SFU from the dLN of a tumor bearing mouse. Levene’s test for homogeneity of variance. b. Correlation between HA-specific IFNγ responses and UQCRC2 specific responses in mice with AB1-HA tumor of more than 100 mm2 in size (n = 33). Association of c. HA responses and tumor size (n = 75) and d. mutant UQCRC2 responses and tumor size (n = 75). Pearson’s correlation coefficient determined by linear regression
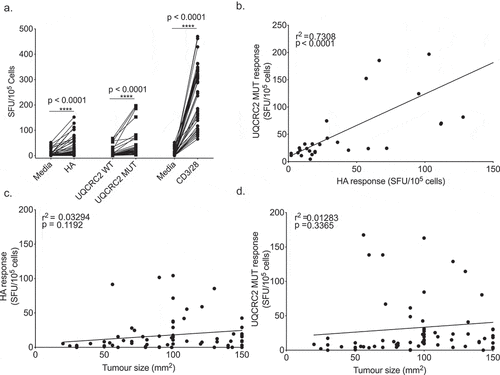
Figure 3. Combination ICPB therapy has limited capacity to broaden the range of neo-antigen specific T cell responses. a. Experimental schema; tumor-bearing mice received 100 µg anti-CTLA-4 and 50 µg anti-GITR on day 10 and dLN were harvested seven days later . b and c. IFNγ responses in the dLN against short HA, UQCRC2 and peptide pools (33 short peptides) in b. untreated and c. treated mice (n = 9). Paired Student’s T-test. d and e. dLN responses against long neo-antigen peptides in D. untreated (n = 3) and e. treated mice (n = 5). One-way ANOVA with Dunnett’s multiple comparison f. Representative ELISPOT wells of neo-antigen long-peptide responses in dLN from treated and untreated mice. g. dLN IFNγ responses against predicted UNC45a minimal peptides in treated mice (n = 8). h. Percentage of HA, UQCRC2 and UNC45a specific killing in dLN and ndLN of treated mice (n = 5). Paired Student’s T-test was performed to compared responses between ndLN and dLN. Error bars represent mean ± SD. i. Representative histogram of CTL assay in the dLN and ndLN of one mouse
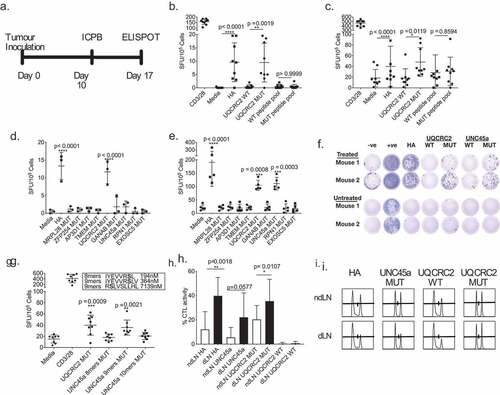
Figure 4. Combination ICPB-induced neo-antigen specific T cells are not excluded from tumors. IFNγ responses to a. HA, b. UQCRC2, and c. UNC45a short peptides in dLNs of treated and untreated mice (n = 23–28). Tumor CD8+ tumor infiltrating lymphocyte responses to d. HA, e. UQCRC2 and f. UNC45a peptides in treated and untreated mice (n = 10). Mixed model ANOVA compared T-cell responses between treated and untreated mice
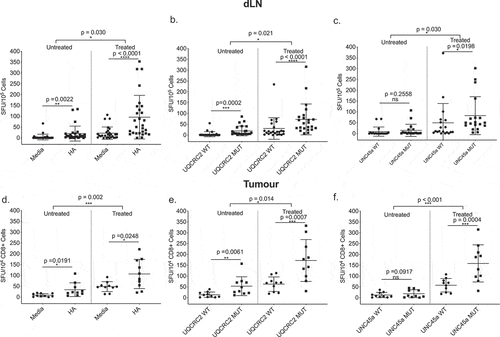
Table 1. Percentage of mice with positive responses to indicated neo-antigens in the draining lymph nodes and the tumor of treated and untreated mice
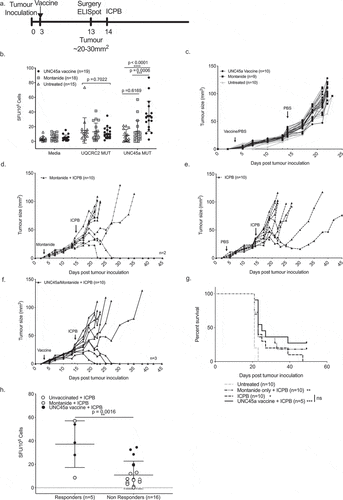
Figure 5. Strong dLN neo-antigen responses to UNC45a predict combination ICPB outcomes
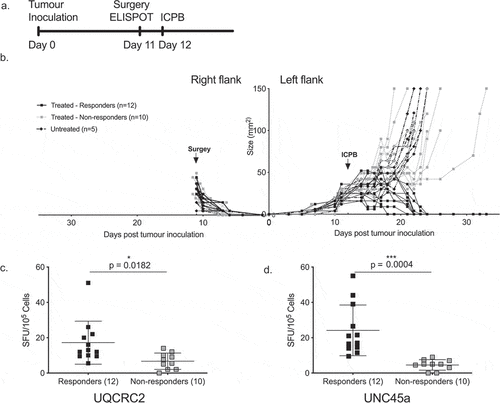
Figure 6. Boosting UNC45a specific T cells does not improve responses to combination ICPB