Figures & data
Table 1. NetH2pan PyMT peptide predictions. The PyMT protein amino acid sequence was entered into NetH2pan with the following search parameters: Peptide Length: 8-11mer peptides, Species/loci: Mouse (H-2), Allele: H-2Dq, and sorted by predicted affinity. Bold: eluted PyMT peptides from soluble MHC/tumors
Figure 1. Soluble MHC elution matches H-2Dq profile and identifies H-2Dq PyMT-peptides . a) ELISA results of sMHC production from HeLa cells plotted against a standard curve of purified VLDL-tagged sMHC. b) Evaluation of PyMT expression using flow cytometry in HeLa-H-2Dq cells. An N-terminal flag-tag was engineered onto PyMT and an anti-FLAG antibody was used for staining. c) Peptide length distribution, d) Binding motif generated with Seq2Logo, e) Source protein distribution of eluted peptides, c-e) represent data from 8424 peptides eluted from soluble H-2Dq and PyMT co-transfected HeLa cells, f,g) MS2 fragment spectra from DDA acquisition containing b/y ions from synthetic MT241-250 and MT288-296 and sMHC-eluted peptides
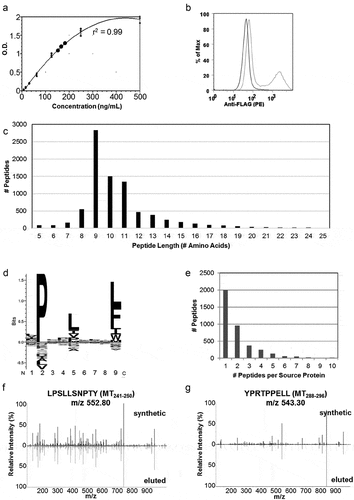
Figure 2. MMTV-PyMT tumors present PyMT-specific class I MHC peptides. a) Experimental approach to identify peptides directly from tumors. Peptides were extracted and identified using two types of data acquisition. DDA = Data Dependent Acquisition, DIA/SWATH = Data Independent Acquisition. b) MS2 spectra from DDA acquisition: b/y ions of PyMT peptides eluted from tumors vs. high-purity synthetic peptides. c) SWATH acquisition data matched to PyMT synthetics using Skyline Software. Peaks were matched by retention times and peak area. Top panel: precursor, [M + 1], [M + 2] compared to theoretical isotopic distribution, bottom panel: b/y ions compared to library. Analysis of idotp/dotp show close agreement to expected/library values. RT = Retention Time
![Figure 2. MMTV-PyMT tumors present PyMT-specific class I MHC peptides. a) Experimental approach to identify peptides directly from tumors. Peptides were extracted and identified using two types of data acquisition. DDA = Data Dependent Acquisition, DIA/SWATH = Data Independent Acquisition. b) MS2 spectra from DDA acquisition: b/y ions of PyMT peptides eluted from tumors vs. high-purity synthetic peptides. c) SWATH acquisition data matched to PyMT synthetics using Skyline Software. Peaks were matched by retention times and peak area. Top panel: precursor, [M + 1], [M + 2] compared to theoretical isotopic distribution, bottom panel: b/y ions compared to library. Analysis of idotp/dotp show close agreement to expected/library values. RT = Retention Time](/cms/asset/a362353c-e92d-4cb7-abf8-2c67c894cb06/koni_a_1685300_f0002_oc.jpg)
Table 2. Summary of PyMT peptides: ELISPOT responses and complementary approaches used for each peptide identification; NetH2pan rank corresponds to “Rank%” from NetH2pan H-2Dq output
Figure 3. DNA vaccination confirms H-2Dq PyMT epitope immunogenicity: a) PyMT and GM-CSF western blot following transient transfection of 293T cells with DNA plasmid vaccine: (-) untransfected 293T, (+) transfected 293T. GM-CSF transfected cells were treated with cellular transport inhibitor for 4 hours prior to analysis, b) DNA vaccine timeline, c) Overlapping 15mer design. MT19–27: pool 1 (#1-10), MT107–115: pool 4 (#31-40), MT241–250: pool 8 (#71-80) and 9 (#81-90), MT288–296: pool 10 (#91-100), MT326–335: pool 11(#101-110), d) Anti-IFNγ ELISPOT following 24 hour overlapping peptide restimulation of splenocytes from vaccinated mice, e) Anti-IFNγ responses with representative ELISPOT picture to minimal epitopes of PyMT H-2Dq peptides following 24 hour peptide stimulation of splenocytes from vaccinated mice. Each row represents one mouse; columns represent duplicates of peptide or DMSO-only restimulation
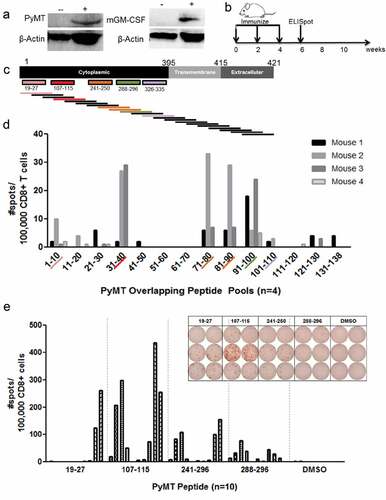
Figure 4. PyMT DNA vaccination prevented MMTV-PyMT tumor growth
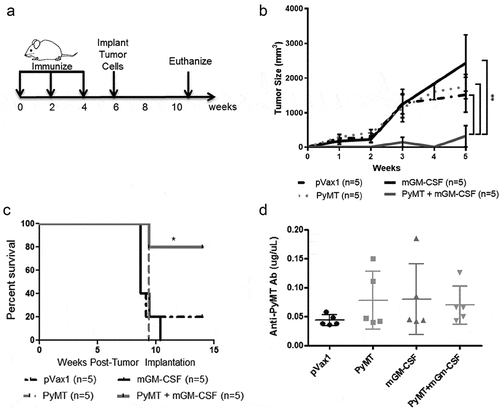
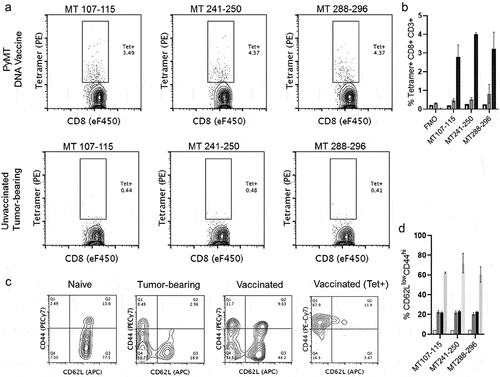
Figure 5. PyMT-Dq tetramers label antigen-specific CD8 + T cells after vaccination. a) Top Row) Naïve FVB mice were vaccinated and boosted twice with PyMT + mGM-CSF DNA plasmids. Two weeks after the final booster, splenocytes were harvested and analyzed with flow cytometry. Bottom Row) Naïve FVB mice received mammary fat pad transplants of 250,000 MMTV-PyMT tumor cells. Once tumors reached 2cm3, mice were euthanized and splenocytes were stained with tetramers for PyMT-specific T cells. Left-to-Right) H-2Dq tetramers in separate staining panels: MT107-115, MT241-250, and MT288-296. These data have previously been gated on viability/CD3+/CD8α+. b) Quantification of tetramer staining, c) Phenotype of CD8 + T cells in naïve, tumor-bearing, vaccinated, or antigen-specific (vaccinated) settings. Each of the panels were gated on viability/CD3+/CD8 α +, with an additional gate for tetramer+ staining. d) Quantification of CD62LlowCD44hi populations. Panels B&D groups (n = 2/group): Naïve Spleen (clear), Unvaccinated Tumor-bearing (dark gray), PyMT Vaccinated (black), PyMT Vaccinated>Tetramer+ (light gray)