
Figures & data
Table 1. Patient features
Table 2. Activity data for overall population and subgroups
Table 3. Univariate and multivariate analyses for PFS
Table 4. Univariate and multivariate analyses for OS
Figure 1. Kaplan–Meier survival curves according to FHC. (a) Progression-free survival. FHC-negative: 9.3 months (95% CI: 7.5–10.6; 277 events); FHC-low: 8.4 months (95% CI: 7–11.4; 166 events); FHC-high: 20.5 months (95% CI: 8.7–26.4; 36 events). (b) Overall survival. FHC-negative: 18.2 months (95% CI: 14.9–23.9; 250 censored patients); FHC-low: 20.8 months (95% CI: 15.4–20.9; 176 censored patients); FHC-high: 31.6 months (95% CI: 26.2–31.6; 51 censored patients)
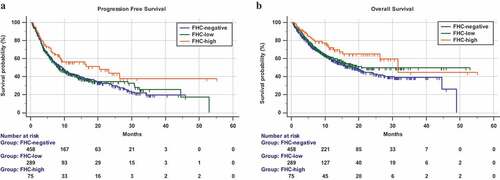
Figure 2. Kaplan–Meier survival curves according to MN. (a) Progression-free survival. MN-negative: 8.7 months (95% CI: 7.6–10.2; 414 events); MN-low: 12.3 months (95% CI: 8.3–28.9; 58 events); MN-high: 14.4 months (95% CI: 3.6–14.5; 7 events). (b) Overall survival. MN-negative: 20.5 months (95% CI: 15.7–27.1; 43 censored patients); MN-low: 26.2 months (95% CI: 18.7–48.9; 66 censored patients); MN-high: 15.9 months (95% CI: 10.5–15.9; 8 censored patients)
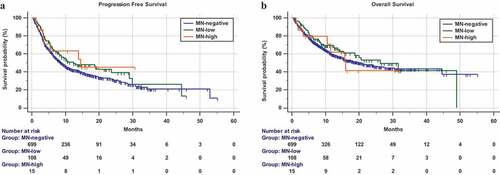
Table 5. Univariate and multivariate analysis for incidence of irAEs of any grade