Figures & data
Figure 1. ASTX660 combined with TNFα induces surface expression of CRT/HSP70 and release of HMGB1. UMSCC-46 (HPV-) and UMSCC-47 (HPV+) were treated with mitoxantrone (MTX, 0.25 μg/mL for UMSCC-46 and 1 μg/mL for UMSCC-47, positive control), TNFα (20 ng/mL), ASTX660 (500 nM for UMSCC-46 and 1μM for UMSCC-47), and the combination of ASTX660 + TNFα for 24–72 hours and analyzed by flow cytometry. (a-b) Quantification of % cells expressing surface CRT (a) and HSP70 (b) after 24 hours (UMSCC-46; more sensitive) or 48 hours (UMSCC-47; less sensitive). Results from viable, Zombie Yellow-negative cells are shown. (c) Quantification of % cells with low levels of intracellular HMGB1 by flow cytometry on fixed, permeabilized cells after 48 hours (UMSCC-46; more sensitive) or 72 hours (UMSCC-47; less sensitive). (d) Measurement of extracellular HMGB1 in cell culture supernatants by ELISA, expressed as fold-change of the control. Data are mean + SEM, n = 6 from 2 independent experiments. *p < .05, **p < .01 versus control. TNFα, tumor necrosis factor α; ICD, immunogenic cell death; CRT, calreticulin; HSP70, heat shock protein 70. MTX, mitoxantrone; HMGB1, high mobility group box 1
Figure 2. ASTX660 alters expression of DAMPs in murine cell lines and modestly enhances XRT-induced ICD to reject tumor formation in vivo. (a-b) MOC1 and MEER cell lines were treated for 24 hours with mitoxantrone (MTX, 1 μg/ml) or ASTX660 (1 μM) +TNFα (20 ng/ml), then stained for surface calreticulin and HSP70. Results from viable, Zombie Yellow-negative cells are shown. (c). MOC1 and MEER cells were treated for 72 hours with control media or ASTX660+ TNFα, then radiated (100 Gy), fixed, and stained for intracellular HMGB1. Gating strategies are shown in Supplemental Data.(d-g) Mice were inoculated with sham saline (negative control) or 2 × 10⁶ MOC1 or MEER cells killed in vitro by the following: radiation (100 Gy, positive control), MTX (1 μg/mL x 24 hours, positive control), ASTX660 (1 μM x 72 hours) + TNFα (20 ng/mL x 72 hours), ASTX660 (x 72 hours) + TNFα (x 72 hours) + radiation (100 Gy). This was followed by re-challenge with respective live MOC1 (3x10⁶ cells) or MEER (1x10⁶ cells) one week later. (d) Treatment schematic. (e) MOC1 and (f) MEER tumor growth of individual animals. (g) Corresponding Kaplan-Meier curves for % tumor free mice (n = 10–11). For both MOC1 and MEER, all treatments significantly delayed or rejected tumor growth compared to controls (p < .01). XRT, radiation; MTX, mitoxantrone; TNFα, tumor necrosis factor α
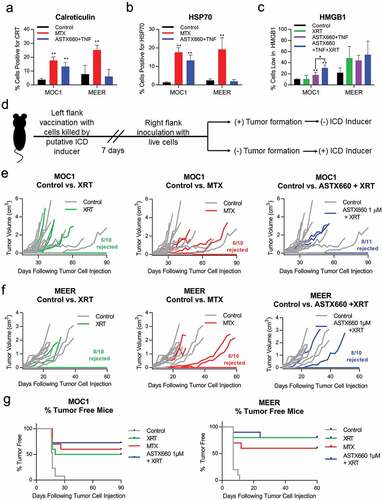
Figure 3. Treatment with ASTX660 and XRT enhances T cell number and function. Using the MEER syngeneic mouse model, engrafted tumors were treated with ASTX660 by oral gavage (16 mg/kg), XRT (single dose of 8 Gy), or the combination of both. Tumors, spleens, and DLNs were harvested and analyzed by flow cytometry for CD8+ lymphocytes. A subset of tumors were digested and magnetically sorted for T cells and co-cultured with inactivated dendritic cells presenting p15E peptide. Subsequent IFN-γ production was quantified using ELISpot assay. (a) Mouse treatment schema. (b-d) CD8+ T-lymphocytes per 10,000 cells in tumors, spleens, and DLNs. (e-f) Quantification of IFN-γ-producing T cells among various treatment groups with representative ELISpot plate images. PMA/ionomycin was the positive control and ovalbumin was the negative control. (g) MHC class I expression on CD45− tumor cells. *p < .05, **p < .01 versus control. DLN, draining lymph node; TIL, tumor infiltrating lymphocyte; IFN-γ, interferon-γ; MHC, major histocompatibility complex, MFI, mean fluorescence intensity
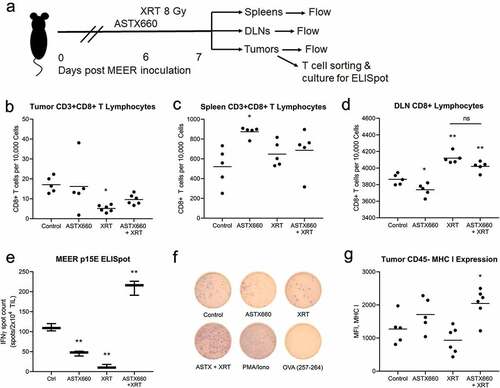
Figure 4. ASTX660 enhances TIL-mediated killing of HNSCC cell lines. TIL were cultured from MOC1, MEER, and MOC2 tumor fragments, enriched, and magnetically sorted for T cells. Tumor cells were plated and allowed to grow for 24 hours before addition of ASTX660 (500 nM) and effector T cells at a 1:1 effector:target (E:T) ratio. Impedance lines are graphed as averages of 3 replicates normalized to a cell index of 1.0 at 24 hours when ASTX660 and/or T cells were added. TIL, tumor infiltrating lymphocytes
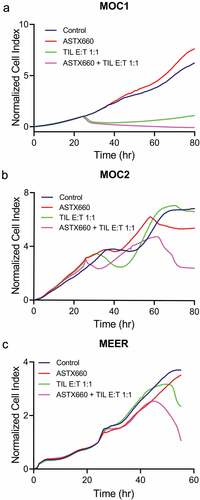
Figure 5. Schematic for intracellular APM components. Antigen processing is an intracellular pathway whereby endogenous or foreign proteins are broken down into peptides by the proteasome, transported into the endoplasmic reticulin, loaded onto MHC class I, and transported to the cell surface for recognition by the adaptive immune system. Several proteases, transporters and chaperones are involved
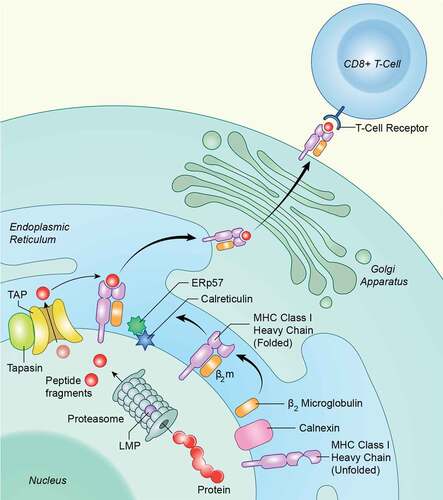
Figure 6. ASTX660 combined with TNFα differentially alters APM across various human HNSCC cell lines. UMSCC-74A (HPV-), −11B(HPV-), −47(HPV+), −46 (HPV-) cells were treated with IFN-γ (10 ng/mL, positive control), TNFα (20 ng/mL), ASTX660 (500 nM or 1 μM), and ASTX660 (250 nM, 500 nM, or 1 μM) + TNFα for 48 hours prior to staining and analysis by flow cytometry. Data are represented as mean + SEM, n = 6–9 from at least 2 independent experiments. *p < .05 versus control. APM, antigen processing machinery; IFN-γ, interferon-γ; TNFα, tumor necrosis factor α; MFI, mean fluorescence intensity