
Figures & data
Figure 1. Stat3 silencing induces senescence in cancer cells addicted to Stat3 signaling pathway
(a–c) Cells were transfected with 100 nmol/L control siRNA (siControl) or Stat3 siRNA (siStat3) for 48 h. (a) Senescence associated-ß galactosidase (SA-ß-gal) staining was performed and the graph shown the percentages of positive cells (n = 50, triplicates). (b) Immunoblot of phospho-Stat3 (pStat3 (Tyr705)) and Stat3 from cell lysates. Numbers below represent pStat3 (Tyr705)/Stat3 ratio. (c) Cell proliferation of transfected cells was determined by [H3] thymidine incorporation at 48 h of culture. (d) BALB/c mice were injected s.c. with 104 4T1 cells and C57BL/6 mice were injected s.c. with 2 × 10⁵ B16 cells. When tumors reached ~100 mm3 animals were injected i.p. with 1mg/kg/day of JSI-124 (n = 5–6 mice per group). Tumor volume was monitored along 10 days. (e) SA-ß-gal staining was performed in tumors from vehicle- and JSI-124-treated animals. Representative photos are shown. Bars, 10 µm. Data are presented as means ± SE. Data shown are representative of three independent experiments. p values were calculated using two-tailed Student´s t test in a, c and two-way ANOVA test in d. ns, not significant, *p < .05, **p < .01, ***p< .001, ****p < .0001.
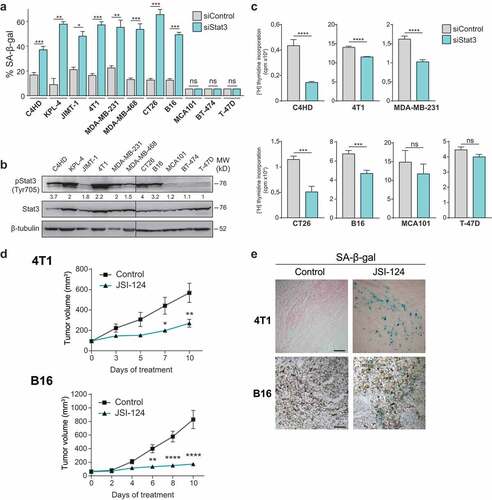
Figure 2. Antitumor activity of SASP from Stat3-silenced cancer cells
4T1, B16, MDA-MB231, and MCA101 cells were transfected with 100 nmol/L siControl or siStat3 and conditioned mediums (CM-siControl or CM-siStat3, respectively) were obtained as described in Materials and methods. (a) Tumor cells were cultured for 48 h with CM-siControl or CM-siStat3 produced by the same cell line as indicated. Proliferation was determined by [3H] thymidine incorporation (n = 8). (b) Monolayers of tumor cells were wounded and allowed to migrate into the cell-free area in presence of CM-siControl or CM-siStat3 of tumor cells or control medium as indicated. Wounded areas were photographed at 0 and 18 h and quantified by densitometry (n = 4). (c) HUVEC cells were cultured for 48 h in presence of CM-siControl or CM-siStat3 of tumor cells or control medium as indicated, and proliferation was measured by [3H] thymidine incorporation (n = 8). (d-f) Purified T cells from spleen of BALB/c mice were activated with CD3/CD28 beads in the presence of CM-siControl or CM-siStat3 from 4T1 or MCA101 cells for 72 h. Similar protocols were followed with CM of B16 cells but T cells were isolated from the spleen of C57BL/6 mice. (d) Proliferation was determined by [3H] thymidine incorporation at 48 h (n = 8). (e) Activation of CD4+ or CD8 + T cells was determined immunofluorescence using anti-CD69 antibody and flow cytometry (n = 4). (f) Determination of CD4 + T and CD8 + T effector, central memory, and naïve T cells were determined by immunofluorescence using anti-CD62L and CD44 antibodies, and flow cytometry (n = 4). Data are presented as means ± SE. All data shown are representative of three independent experiments. p values were calculated using two-tailed Student´s t test in a, b, d–f and by one-way ANOVA with Tukey’s post-test in c. ns, not significant; *p < .05, **p< .01, ***p < .001, ****p < .0001.
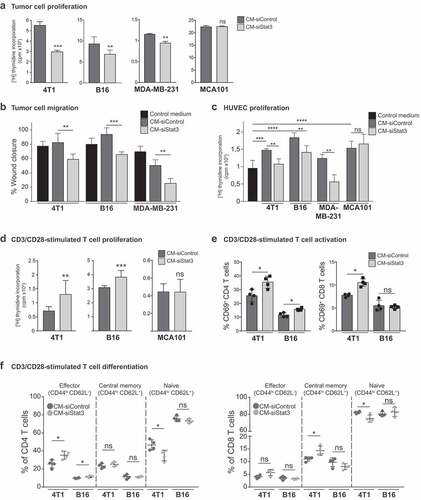
Figure 3. Immunotherapy of SASP from Stat3-silenced 4T1 cells with irradiated wild type cells promotes an antitumor immune response
(a) Immunotherapy protocol. BALB/c mice were challenged s.c. with 104 4T1 cells. When tumors were palpable, animals were injected s.c. with 106 irradiated 4T1 cells (100 Gy) and with a depot containing the lyophilized CM-siControl or CM-siStat3 from 4T1 cells once a week for 3 weeks. Control group received PBS and irradiated 4T1 cells. Ten days after the last immunization, mice were sacrificed and the immune response was evaluated (n = 5 mice per group). (b) Tumor volume was monitored along the experiment. (c) Lungs were harvested, fixed, and the number of 4T1 tumor nodules was counted. (d) Tumor-infiltrating leukocytes and T cells were determined by CD45 and TCRß staining, respectively, and the number was referred to g tumor. (e) Effector CD4+ and CD8 + T cells were determined by CD44 and CD62L staining in tumor and spleen and analyzed by flow cytometry. (f) Intratumor and spleen NK cell activation was determined by staining with anti-CD69 on the CD3-/DX5+ population. (g) The percentage of Tregs (FOXP3+/CD25+) from total CD4 + T cells of the tumor and spleen was determined by immunofluorescence and analyzed by flow cytometry. (h) Tumor-infiltrating G-MDSC and M-MDSC populations were determined by Ly6C and Ly6G staining in the CD11b+ gate, and the number was referred to g tumor. In spleen, both populations were referred to as percentage of CD45+ cells. (i) PD-L1 and PD-L2 expression levels of G-MDSC and M-MDSC populations staining in tumor were analyzed by flow cytometry. (j) BALB/c mice were challenged s.c. with 104 4T1 cells. When tumors were palpable, animals were injected s.c. with 106 irradiated 4T1 cells (100 Gy) and with a depot containing the lyophilized CM-siControl or CM-siStat3 from B16 cells once a week for 2 weeks. Tumor volume was monitored (n = 5 mice per group). Data are presented as means ± SE. Data shown are representative of three independent experiments b-i and of one experiment j. p values were calculated using two-way ANOVA test in b, j and two-tailed Student´s t test in c-i. *p < .05; **p < .01, ***p < .001, ****p < .0001.
Figure 4. Immunotherapy with SASP from Stat3-silenced cancer cells acts in synergy with anti-PD-1 antibodies
(a) Immunotherapy protocol. C57BL/6 mice were challenged s.c. with 2 × 10⁵ B16 cells. When tumors were palpable, animals were injected s.c. with 106 irradiated B16 cells (100 Gy) and with a depot containing the lyophilized CM-siControl or CM-siStat3 from B16 cells every 5 days for 10 days. Three groups of animals received i.p. anti-PD-1 antibodies (10 mg/kg) at the same time of the above-mentioned immunotherapy. Control group received PBS and irradiated B16 cells. (b) Tumor volume was monitored along the experiment (n = 6 per group). (c) Survival curves exhibit differences of therapeutic efficacy of the immunotherapies in B16 melanoma. Percentage of survival represents either live mice or whose tumors were below 1000 mm3 (n = 7–10 mice per group). (d) IFN-γ production by OVA-specific CD8 + T cells determined by ELISPOT. Peripheral blood was obtained at day 14 and the production of IFN-γ was assessed by ex-vivo stimulation with SIINFEKL peptide. (e-h) Three days after the last immunization, mice were sacrificed and the immune response was evaluated. (n = 6–5 per group). (e) Tumor-infiltrating leukocytes and T cells were determined by CD45 and TCRß staining, respectively, and the number was referred to g tumor. (f) Effector CD4+ and CD8 + T cells were determined by CD44 and CD62L staining in tumor and spleen and analyzed by flow cytometry. (g) Spleen and tumor NK cell activation was determined by staining with anti-CD69 on the CD3-/NK1.1+ population and analyzed by flow cytometry. (h) Tregs from total CD4 + T-cells of the spleen and tumor were determined by immunofluorescence and analyzed by flow cytometry. (i) C57BL/6 mice were injected s.c. with 2 × 10⁵ B16 cells. When tumors reached ~100 mm3 animals were injected i.p. with 1 mg/kg/day of JSI-124 (n = 5 mice per group) every other day, i.p. anti-PD-1 antibodies (10 mg/kg) on day 0 and 5 or both together. Control group was injected with rat IgG. Tumor volume was monitored for 9 days. Data are presented as means ± SE. Data shown are representative of two independent experiments in b, d–g, cumulative of two independent experiments in c and of one experiment in I. p values were calculated using two-way ANOVA test in b, i, log-rank Mantel–Cox test comparing the two groups, in C and ANOVA with Tukey’s posttest in d–h. ns, not significant, *p < .05, **p < .01, ***p < .001, ****p< .0001.
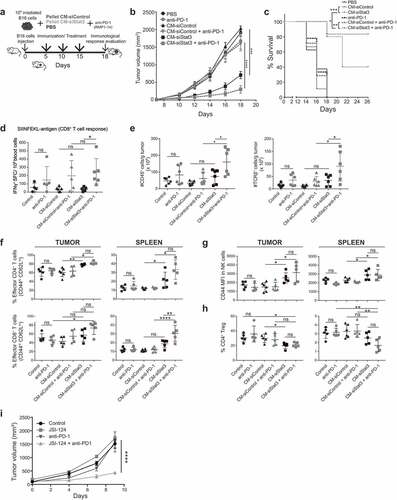
Figure 5. CCL2, CCL5, IL-15, and CXCL10 are mediators of the immune-stimulating activity of the SASP from Stat3-silenced cancer cells
(a) CM-siControl and CM-siStat3 from 4T1 and B16 cells were analyzed using an antibody array for detecting cytokine and chemokine secretion. Heatmap of differentially expressed proteins in CM-siStat3 vs. CM-siControl. (b,c) Determination of different cytokines and chemokines in CM-siControl and CM-siStat3 from 4T1, B16, and MCA101 cells by ELISA. (d) Effect of neutralization of CXCR3, CCL2, CCL5, and IL-15 with specific antibodies on T cell proliferation. Purified T cells from spleen of BALB/c mice were activated with CD3/CD28 beads in the presence of CM-siControl or CM-siStat3 from 4T1 cells for 48 h and the corresponding Armenian hamster or goat control antibodies. In the case of CM-siStat3 different blocking antibodies were included. Data shown of CM-siControl and CM-siStat3 correspond to that obtained with Armenian hamster antibody, yielding similar results to those from goat antibody (not shown). Similar protocols were followed with CM from B16 cells but T cells were isolated from spleen of C57BL/6 mice. Proliferation was determined by [3H] thymidine incorporation at 72 h. Data are presented as means ± SE. Data shown are representative of two (a, b), or three (c, d), independent experiments. p values were calculated using two-tailed Student´s t test in b, c and by ANOVA with Tukey’s posttest in d. ns, not significant, *p < .05, **p < .01, ***p< .001, ****p < .0001.
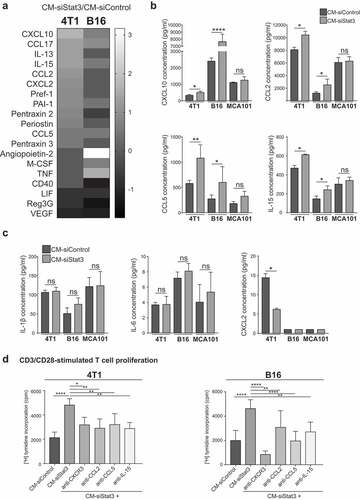
Figure 6. Senescence and type I IFN-related protein production induced by Stat3 silencing is dependent on cGAS
4T1 and B16 cells were transfected with siControl, siStat3, or cGAS siRNA (sicGAS) or with siStat3+ sicGAS siRNA for 48 h. (a) Senescence was determined by labeling with 5-dodecanoylaminofluorescein di-β-D-galactopyranoside (C12FDG). The fluorescence was quantified by flow cytometry thought the mean fluorescence intensity (MFI). (b) Determination of CXCL10 by ELISA in the CM. (c) Determination ISG15 and IFI35 by immunoblot from cell lysates. (d,e) Purified T cells from spleen of BALB/c mice were activated with CD3/CD28 beads in the presence of CM from 4T1 cells. Similar protocols were followed with CM of B16 cell but T cells were isolated from the spleen of C57BL/6 mice. (d) Proliferation was determined by [3H] thymidine incorporation at 48 h (n = 8). (e) Proliferation was determined by [3H] thymidine incorporation at 48 h (n = 8). In the case of CM-siStat3 anti-IFNAR antibody was added. (f) Immunotherapy protocol. BALB/c mice were challenged s.c. with 104 4T1 cells. When tumors were palpable, animals were injected s.c. with 106 irradiated 4T1 cells (100 Gy) and with a depot containing the lyophilized CM-siControl or CM-siStat3 or CM-sicGAS or CM-sicGAS+siStat3 from 4T1 cells once a week for 3 weeks (n = 5 mice per group). (g) Tumor volume was monitored along the experiment. Data are presented as means ± SE. Data shown are representative of three independent experiments (a–e) and of one experiment (g). p values were calculated using ANOVA with Tukey’s posttest in a, b, d, e and two-way ANOVA test in g. *p < .05, **p < .01, ***p< .001, ****p < .0001.
Supplemental material