Figures & data
Figure 1. Cell death driven by PT-112 is associated with DAMP emission. (a). Chemical structure of R,R-1,2 cyclohexanediamine-pyrophosphato-platinum(II) (PT-112). (b). IC50 values associated with exposure of 121 human cancer cell lines to PT-112 for 72 hours. Results are means ± SEM, based on cancer cell histology. Mean IC50 ± SEM for all cells is reported in red. **p < .01 (one-way ANOVA), as compared to all other cells confounded. See also . (c). Residual number of mouse colorectal carcinoma CT26 cells upon exposure to the indicated concentration of PT-112 for 24 or 48 hours. Quantitative results (means ± SEM) are reported. n = 2–3 independent experiments; *p < .05, **p < .01, ***p < .001 (one-way ANOVA), as compared to untreated cells at the same time point. (d). Percentage of DAPI+ (dead) mouse mammary carcinoma TSA cells upon exposure to PT-112 in the indicated concentrations for 24 or 48 hours. Representative dotplots (with percentage of events in each quadrant) and quantitative results (means ± SEM) are reported. n = 2–3 independent experiments; *p < .05, **p < .01, ***p < .001 (one-way ANOVA), as compared to untreated cells at the same time point. (e). CALR exposure on PI− TSA cells upon treatment with 50 µg/mL PT-112, 15 µM cisplatin (CDDP), or 2.5 µM mitoxantrone (MTX) for 24 hours. Representative histograms (isotype staining is reported as dashed profile) and quantitative results (mean MFI ± SEM) are reported. n = 2–3 independent experiments; ***p < .001 (one-way ANOVA), as compared to untreated cells. MFI, mean fluorescence intensity. (f,g). ATP (f) and HMGB1 (g) amounts in the supernatant of TSA cells treated as in panel d. Quantitative results (means ± SEM) are reported. n = 2–3 independent experiments; *p < .05, **p < .01, ***p < .001 (one-way ANOVA), as compared to untreated cells
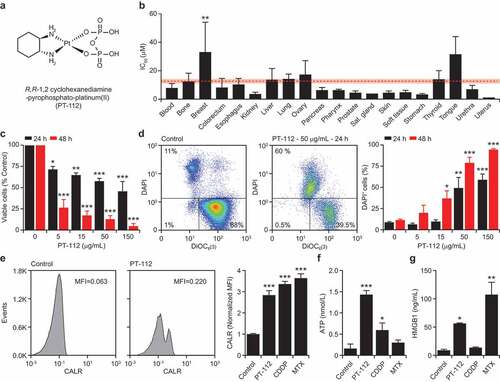
Table 1. Cytostatic and cytotoxic effects of PT-112 against human cancer cell lines (IC50, µM)
Figure 2. PT-112 induces bona fide ICD and can be combined with ICBs in vivo. (a). Tumor-free survival (TFS) and tumor area in BALB/c mice vaccinated with PBS or TSA cells exposed in vitro to 150 µg/mL PT-112, 150 µM cisplatin (CDDP), or 2.5 µM mitoxantrone (MTX) for 24 hours, and (one week later) challenged contralaterally with living TSA cells. Number of mice is indicated. Tumor areas are reported as means ± SEM. ns: not significant, **p < .01 (Log-rank for TFS, two-way ANOVA for tumor area), as compared to PBS-vaccinated mice. See also Suppl. Figure 1. (b). Growth of primary and abscopal TSA lesions established in immunocompetent, syngeneic BALB/c mice that were optionally allocated to receive 150 mg/Kg PT-112 i.t. in the context of optional, systemic CTLA4 blockage. Number of mice and incidence of disease eradication are indicated. Tumor growth data are reported as means ± SEM. ***p < .001 (two-way ANOVA), as compared to untreated mice; #p < .05, ###p < .001 (two-way ANOVA), as compared to mice treated with CTLA4 blockers. (c,d). Growth of CT26 (c) or MC38 (d) tumors established in immunocompetent, syngeneic BALB/c or C57BL/6J mice, respectively, that were allocated to receive 90 mg/Kg PT-112 weekly i.v. in the context of optional, biweekly systemic (i.p.) PD-1 or PD-L1 blockage (or PD-1 or PD-L1 blockage alone). Number of mice, incidence of disease eradication, overall survival (OS), hazard ratio (HR) and p values (two-way ANOVA for tumor growth, Mantel-Cox for OS) are reported. *compared to untreated mice; †compared to mice treated with PT-112; #compared to mice treated with PD-1 or PD-L1 blockers
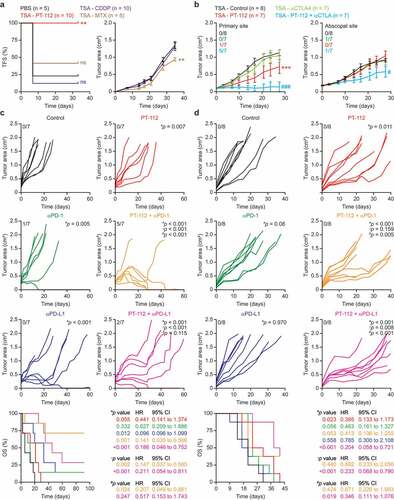
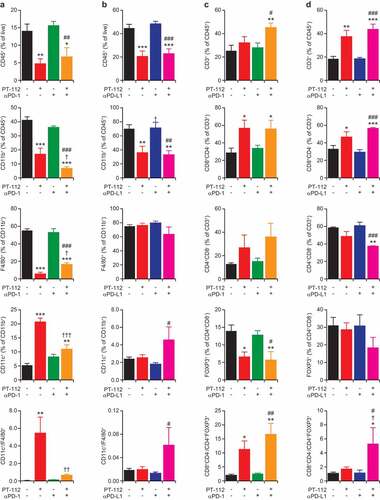
Figure 3. Immune infiltration of CT26 and MC38 responding to PT-112 plus ICBs. (a,b). Percentage of CD45+ (over total live), CD11b+ (over CD45+), F4/80+ (over CD11b+), and CD11c+ (over CD11b+) cells, and CD11c+ to F4/80+ cell ratio, in CT26 (a) and MC38 (b) tumors treated with PT-112 in the context of optional PD-1 (a) or (b) PD-L1 blockage. *p < .05, **p < .01, ***p < .001 (one-way ANOVA), as compared to untreated tumors; †p < .05, ††p < .01, †††p < .001 (one-way ANOVA), as compared to tumors treated with PT-112 only; #p < .05, ##p < .01, ###p < .001 (one-way ANOVA), as compared to tumors treated with PD-1 or PD-L1 blockers only, as relevant. See also Suppl. Figure 2a. (c,d). Percentage of CD3+ (over CD45+), CD8+ (over CD3+), CD4+ (over CD3+), and CD25+FOXP3+ (over CD4+) cells, and CD8+ to CD25+FOXP3+ cell ratio, in CT26 (c) and MC38 (d) tumors treated with PT-112 in the context of optional PD-1 (c) or (d) PD-L1 blockage. *p < .05, **p < .01, ***p < .001 (one-way ANOVA), as compared to untreated tumors; †p < .05 (one-way ANOVA), as compared to tumors treated with PT-112 only; #p < .05, ##p < .01, ###p < .001 (one-way ANOVA), as compared to tumors treated with PD-1 or PD-L1 blockers only, as relevant. See also Suppl. Figure 2b