Figures & data
Figure 1. mTOR signaling in human invasive lobular carcinomas (ILCs) and mouse ILCs. (a) Upper panels: human ILC; immunohistochemistry for phospho-4EBP1 (serine 65), phospho-AKT (threonine 308) and phospho-S6K1 (threonine 389); lower panels: mouse ILC (mILCs) from K14-cre;Cdh1Flox/Flox;Trp53Flox/Flox (KEP) mice and normal mouse mammary gland; immunohistochemistry for phospho-4EBP1 (threonine 37/46), phospho-AKT (serine 473) and phospho-S6 (serine 235/236). Scale bars: 100 μm. (b) Scatter plot representing the percentage of tumor cells staining positive for mTOR signaling markers in mouse ILC (KEP) tumors and in normal mouse mammary glands. The majority of mouse ILC tumors expressed phosporylated 4EBP1 (>10% of tumor cells are positive in 27/30 cases, average 75% of tumor cells), phosphorylated AKT (>10% in 19/30 cases, average 32%) and phosphorylated S6 (>10% in 21/30 cases, average 28%). (c) IC50 values of KEP mouse mammary tumor cells for AZD8055. Cells were cultured under adherent conditions (black bars) or non-adherent conditions (red bars). (d) Immunoblot analysis of mTOR signaling markers in adherently and non-adherently growing KEP cell lines (4 clones from 3 independent tumors) in the absence or presence of AZD8055 (500nM, 24 h)
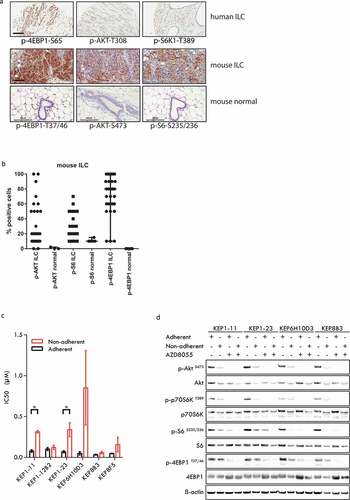
Figure 2. Inhibition of mTOR in vivo blocks KEP tumor growth and delays metastatic disease. (a–d) 28-day neoadjuvant treatment. (a) Schematic overview of experimental setup. Tissue fragments (1 mm3) of a mILC from a KEP donor mouse were orthotopically transplanted in recipient mice. When tumors reached a diameter of 5 mm, a 28-day treatment with daily oral AZD8055 (20 mg/kg, red arrow) or vehicle control solution (black arrow) was initiated. Tumors were surgically removed when they reached a diameter of 15 mm and mice were monitored until terminal metastatic disease developed. (b) Individual tumor growth curves in AZD8055-treated mice (red curves, n = 8) and control mice (black curves, n = 7). (c) Kaplan-Meier plot depicting progression-free survival (PFS) of AZD8055-treated mice (red curve) and control mice (black curve), with progression defined as a doubling in tumor size in mm2 (caliper measurement in two perpendicular directions) from the start of treatment (time point zero). D, Kaplan-Meier plot depicting metastasis-specific survival in AZD8055-treated mice (red curve) and control mice (black curve). Time point zero indicates start of treatment (tumor size 5 mm) in all graphs. E-H, 28-day and prolonged adjuvant treatment. E, schematic overview of experimental setup. Mice were transplanted orthotopically with a 1 mm3 fragment of a mILC from a KEP donor mouse. Tumors were surgically removed when they reached a diameter of 15 mm. After surgery, mice received treatment with daily oral vehicle control solution (black arrow) or 20 mg/kg AZD8055 (20 mg/kg) for 28 days (red arrow) or until they met one of the predefined endpoints: clinically overt metastatic disease or large locally recurrent tumors (green arrow). F, Kaplan-Meier plot depicting metastasis-specific survival of AZD8055-treated mice (red curve, n = 11) and control mice (black curve, n = 11) after 28-day adjuvant treatment (p = .0329). Time point zero indicates start of treatment (tumor size 5 mm). G, Kaplan-Meier plot depicting metastasis-specific survival in AZD8055-treated mice (green curve, n = 18) and control mice (black curve, n = 15) subjected to prolonged adjuvant treatment (p < .0001). Time point zero indicates start of treatment (tumor size 5 mm). End points due to locally recurrent tumors were censored, as well as the sacrifice of one mouse that survived for more than 150 days. H, immunoblot for mTOR signaling markers in lung metastases from AZD8055-treated and control mice from the prolonged adjuvant treatment study. Lung metastases were dissected from 5 AZD8055-treated mice and 5 control mice at the endpoint of the experiment (terminal metastatic disease with dyspnea)
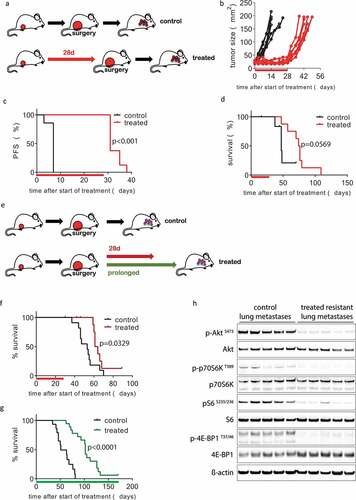
Table 1. Median metastasis-specific survival in five experimental groups
Figure 3. Development of resistance following prolonged neoadjuvant and adjuvant mTOR inhibition. (a) Schematic overview of experimental setup. Tissue fragments (1 mm3) of a mILC from a KEP donor mouse were orthotopically transplanted in recipient mice. Neoadjuvant treatment with daily oral AZD8055 (green arrows) or vehicle control solution (black arrows) was started when tumors reached a diameter of 5 mm. Tumors were surgically removed when they reached a diameter of 15 mm and treatment was continued in the adjuvant setting until mice were sacrificed due to terminal metastatic disease. (b) Individual tumor growth curves in AZD8055-treated mice (green curves, n = 24) and control mice (black curves, n = 10). (c) Kaplan-Meier plot depicting progression-free survival (PFS) of neoadjuvant AZD8055-treated mice (green curve) and control mice (black curve), with progression defined as a doubling in the size of the primary tumor in mm2 from the start of treatment (time point zero). (d) Kaplan-Meier plot depicting metastasis-specific survival in AZD8055-treated mice (green curve) and control mice (black curve). Time point zero indicates start of treatment (tumor size 5 mm) in all graphs. (e) Immunoblot for mTOR signaling markers in five surgically removed tumors from control mice, five therapy-sensitive tumors harvested from AZD8055-treated mice after 5 days of treatment, and five surgically removed therapy-resistant tumors from AZD8055-treated mice
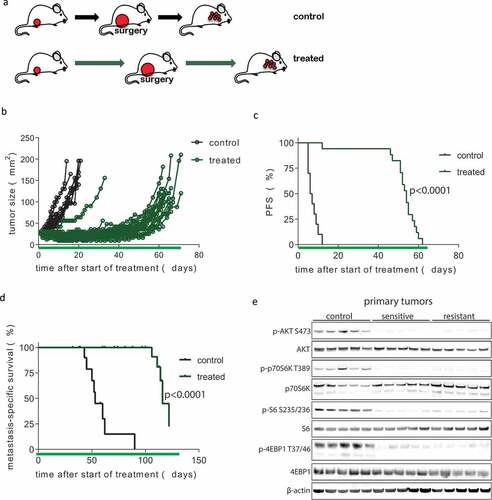
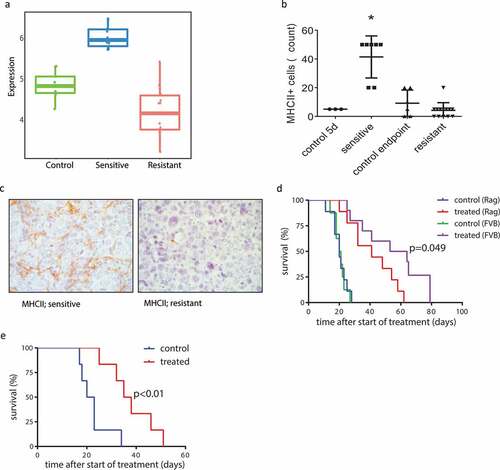
Figure 4. Characterization of AZD8055-sensitive and -resistant mILCs by immunohistochemistry and RPPA analysis. (a) Schematic overview of experimental setup to generate the different tumor groups. Mice were transplanted orthotopically with a 1 mm3 fragment of a mILC from a KEP donor mouse. When tumors reached a diameter of 5 mm, daily treatment with AZD8055 (green arrows) or vehicle control solution (black arrows) was started. AZD8055-sensitive tumors (n = 10) were harvested after 5 days of AZD8055 treatment. AZD8055-resistant tumors (n = 20) were harvested when they progressed on AZD8055 treatment to a diameter of 15 mm. Vehicle-treated control tumors were harvested after 5 days (n = 4) or when they reached a diameter of 15 mm (n = 6). (b) Immunohistochemical quantification of percentages of Ki-67 positive tumor cells in peripheral tumor parts. * p < .05; *** p < .001. (c) Immunohistochemical quantification of number of cleaved caspase 3 (CC3) positive tumor cells per 10 high magnification fields of view. (d) Unsupervised hierarchical clustering analysis of Reverse Phase Protein Array (RPPA) data from 29 KEP tumors (9 control tumors, 5 AZD8055-sensitive tumors, and 15 AZD8055-resistant tumors). The heatmap shows expression levels of selected epitopes representing known PI3K signaling markers. The complete heatmap is shown in Supplementary Fig. S4
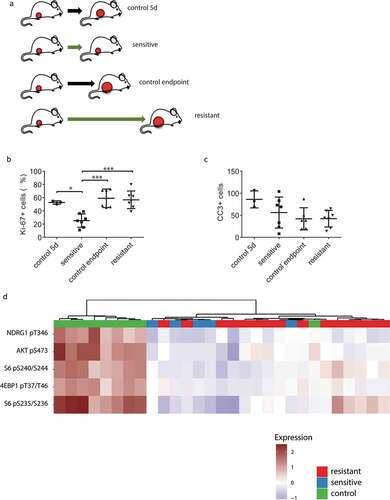
Table 2. Gene ontology analysis of differential transcript expression for control tumors, treatment-sensitive tumors and treatment-resistant tumors (top enriched GO IDs with p-value <0.01)
Figure 5. Involvement of the adaptive immune system in response and acquired resistance to AZD8055. (a) Metagene score for RNA expression levels (relative numbers of transcript reads) of genes involved in antigen presentation via MHCII, of vehicle-treated control tumors (green), AZD8055-sensitive tumors (blue), and AZD8055-resistant tumors (red). Sensitive vs control p < .0001, resistant vs control p = .0023, resistant vs sensitive p < .0001. (b) Immunohistochemical quantification of MHCII positive cells in control tumors and AZD8055-sensitive and -resistant tumors. Shown are numbers of MHCII positive cells per 5 high magnification fields of view. Asterisk (*) indicates a significant difference between sensitive tumors and all three other groups (p < .0001). (c) Representative microphotographs of immunohistochemical detection of cells expressing MHCII in the stroma of AZD8055-sensitive and AZD8055-resistant tumors. (d) Transplantation and treatment of a treatment-naïve KEP tumor in Rag1−/- mice lacking mature T and B lymphocytes and immunocompetent FVB/N mice. Orthotopic transplantation of a 1 mm mILC tumor fragment was performed and the mice received 28 days of neoadjuvant treatment with AZD8055 or vehicle control. An event was recorded in a Kaplan-Meier analysis when the primary tumor reached a diameter of 15 mm. Median latency: 20 days (control, Rag1−/- mice, n = 9), 20.5 days (control, FVB/N mice, n = 7), 41 days (treated, Rag1−/- mice, n = 9), and 58.5 days (treated, FVB/N mice, n = 10). Treated Rag1−/- mice vs FVB/N mice: p = .049. Treated FVB/N mice vs control FVB/N mice: p < .0001. Treated Rag1−/- mice vs control Rag1−/- mice: p = .0004. (e) Serial transplantation and treatment of an AZD8055-resistant tumor in a naïve cohort of immunocompetent FVB/N mice. FVB/N mice received an orthotopic transplantation with a 1 mm piece taken from a resistant tumor (treated until endpoint), and received 28 days of neoadjuvant treatment with AZD8055 or vehicle control. An event was recorded in a Kaplan-Meier analysis when the primary tumor reached a diameter of 15 mm. Median latency: 36.5 (treated) and 21.5 days (control), p = .0053. Control: n = 6. Treated: n = 6