Figures & data
Figure 1. miR-155-overexpressing bone marrow cells reduce tumor growth and lung metastasis. (a) Timeline of this experiment. Seven-week-old, female C57BL/6 mice received oral antibiotics for 2 weeks both prior to and after lethal irradiation and bone marrow transplantation with either WT or miR-155tg bone marrow. 4 weeks after BMT, 2 × 10⁵ EO771 tumor cells were implanted into each of the 4th pair of mammary fat pads, tumor growth was monitored and the mice were sacrificed 35 days after tumor inoculation. (b) miR-155 expression in bone marrow (BM) of all mice at the conclusion of the study to confirm successful bone marrow transplant. Tumor growth over 35 days (c) and tumor weights (d) at sacrifice. Manual counting of lung surface metastases (e) and measured average size determined using serial lung sections (f). Results are shown as means ± SEM (n = 10). *p < .05, **p < .01, ***p < .005
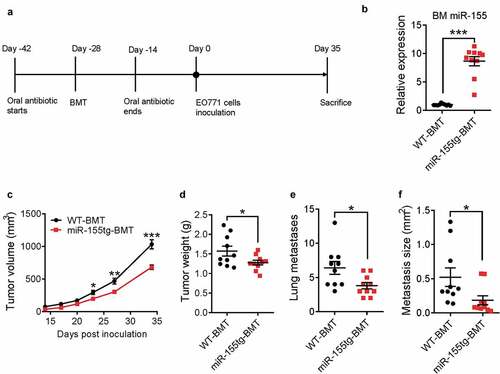
Figure 2. miR155 overexpressing bone marrow cells elicit enhanced antitumor response. Total circulating T cells (a) and CD8+ (b) and CD4+ (c) T cells of WT or miR-155tg BMT mice carrying EO771 breast tumor. (n = 5). Total cells, and CD8+ or CD4+ T cells in spleens (d) and tumor-draining lymph nodes (e). (n = 10). Absolute numbers of active cytotoxic T cells (CD8+IFNγ+) in spleens (f) and tumor draining lymph nodes (g). (n = 5). Results are shown as means ± SEM (n = 5 or 10). *p < .05, **p < .01, ***p < .005
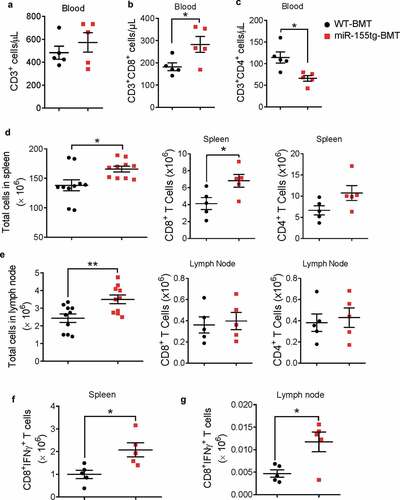
Figure 3. miR155 overexpression increases dendritic cell frequency, maturation, and migration. (a) DC frequencies in the spleens, tumors and lymph nodes of tumor bearing mice. (n = 5). (b, c) DC maturation of splenic, tumor and lymph node DCs was determined by MHCII, CD40, CD80, and CD86 staining. (n = 5). (d) miR155tg and WT BMDCs were pulsed with tumor antigen (TuAg) and stained for maturation markers (MHCII, CD80, and CD86), and analyzed with flow cytometry. (n = 3). (e) Frequencies of CCR7 highly expressed DCs (CCR7hi) in tumor and lymph node of WT or miR-155tg BMT mice. (n = 5). (f) CCR7 expression on WT and miR155tg BMDCs with or without TuAg treatment. (n = 3). (g) WT and miR155tg DCs were pulsed with tumor material, then exposed to a CCL19 gradient. Migration in response to CCL19 through a trans-well insert was quantified (left) and representative images were shown (right). (n = 3). Results are shown as means ± SEM. *p < .05, **p < .01, ***p < .005
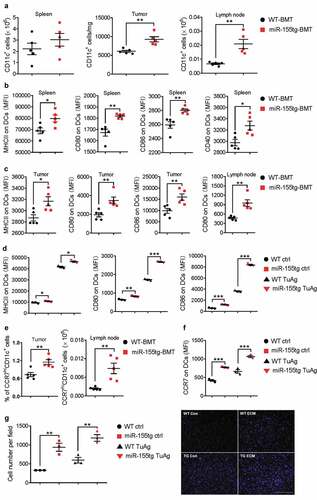
Figure 4. miR155 overexpression enhances the capability of DCs to activate T cells. WT and miR155tg DCs were pulsed with tumor antigen, then co-cultured with tumor antigen-inexperienced WT T cells. (a) After 48 hours of co-culture, T cells were stained for CD3, CD4, CD8, CD69, and IFNγ, then analyzed using flow cytometry. (n = 3). (b) Some tumor antigen-inexperienced T cells were stained with CFSE prior to co-culture; after 120 hours of co-culture, T cell CFSE fluorescence was analyzed using flow cytometry. The “Proliferation” tool in FlowJo was used to analyze the samples and assign the Proliferation Index. (n = 3). (c–e) Tumor-bearing WT mice were s.c. injected twice with tumor antigen-pulsed WT or miR155tg DCs. Tumors, spleens, and tumor draining lymph nodes were then harvested, and dissociated to a single cell suspension. Tumor-draining lymph node and spleen cellularity after tumor antigen pulsed DCs s.c. injections. (n = 6–8) (c). Activation of CD4+ (d) or CD8+ (e) T cells was analyzed using CD45, CD3, CD4, CD8, and CD69 antibodies and flow cytometry. Results are shown as means ± SEM. (n = 3–8). *p < .05, **p < .01, ***p < .005
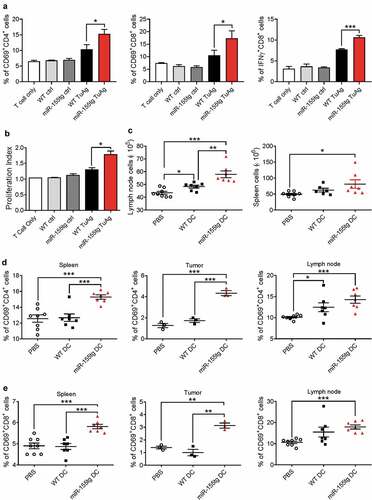
Figure 5. Lentivirus-mediated miR155 overexpression enhances the capability of DCs to activate T cells. (a) BMDCs infected with LV-pWPI or LV-Bic were pulsed with tumor material, stained for maturation markers (MHCII, CD80, and CD86), and analyzed with flow cytometry. (n = 3). (b) Tumor-bearing WT mice were s.c. injected tumor-pulsed LV-pWPI or LV-Bic DCs. Tumor draining lymph nodes were weighed and total cells were counted using a glass slide hemocytometer. (n = 6). (c) Tumor draining lymph nodes were then harvested, dissociated to a single cell suspension, and stained with CD3, CD4, CD8, CD69 or IFNγ antibodies. Stained cells were analyzed by flow cytometry. (n = 5–6). Results are shown as means ± SEM. *p < .05, **p < .01, ***p < .005
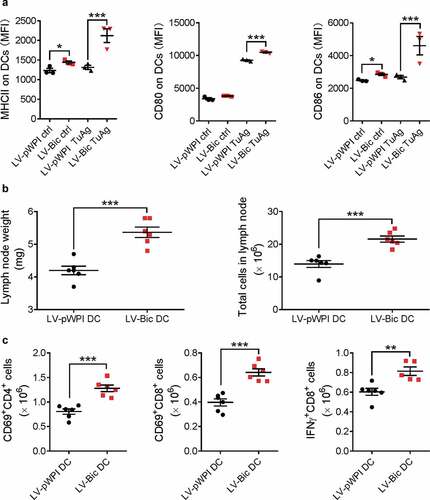
Figure 6. miR-155-overexpression in DCs boosts antigen-specific activation of T cells. (a) Day 8 WT and miR155tg BMDCs were pulsed with OVA whole protein (500 µg/ml) with or without tumor antigen (TuAg, Conditioned medium + cell lysate) for 24 h, the maturation status of DC was determined by MHCII, CD40, CD80, and CD86 expression using flow cytometry. (b) Above mentioned BMDCs treated by OVA and/or TuAg were co-cultured with T cells isolated from the spleen of OT-I mouse for 24 h. T cells were harvested and antigen specific T cell activation was analyzed using flow cytometry by staining of CD69, CD44 and CD62L. (c) 1 × 10⁴ antigen experienced T cells were transferred into IFNγ mAb pre-coated ELISpot plate for another 24 h, ELISpot assay was performed and IFNγ spots were counted under a dissection microscope. Results are shown as means ± SEM. (n = 3). *p < .05, **p < .01, ***p < .005
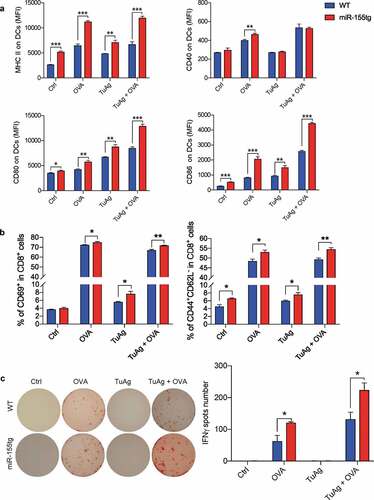
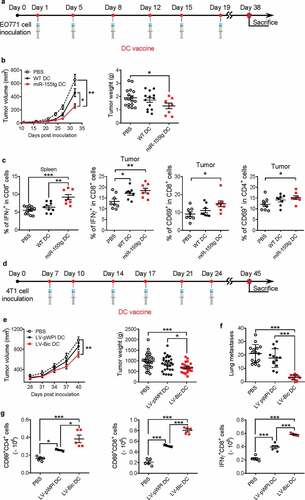
Figure 7. miR155 overexpression enhances the efficacy of DC vaccine. (a) Timeline of the experiment of EO771 orthotopic breast cancer model. Seven-week-old, female C57Bl/6 mice were inoculated with 2 × 10⁵ EO771 cells in each of the 4th pair of mammary fat pads. Beginning on the following day for 3 weeks, mice received twice-weekly s.c. injections of tumor-pulsed WT or miR155tg DCs; and mice were sacrificed 38 days after tumor implantation. (b) Tumor growth and tumor weight at sacrifice. (n = 8–17). (c) T cell activation in spleens or tumors was determined by staining for CD3, CD4, CD8, CD69 and IFNγ on single cell suspensions and performing flow cytometry. (n = 8–13). (d) Timeline of the experiment of 4T1 orthotopic breast cancer model. Balb/c mice were inoculated with 2 × 10⁵ 4T1 cells and treated with DC vaccine with or without forced miR-155 expression by lentiviral transduction at indicated time points. (e) Tumor growth was monitored till Day 40 post-tumor inoculation. (n = 23–30). (f) Tumor pulmonary metastatic nodules were counted at the experimental end-point. (n = 13–15). (g) At the end-point, tumor draining lymph nodes from the surviving mice were analyzed for activated T cells; the absolute numbers of activated T cells are shown. (n = 13–15). Results are shown as means ± SEM. *p < .05, **p < .01, ***p < .005