Figures & data
Figure 1. S100A4 expression is associated with fibrosis-related HCC. (a) Immunohistochemical staining of S100A4 in 75 HCC tissues and 75 adjacent cancer-free tissues in a tissue array was performed. (a) Representative S100A4 staining is shown. (b) Percentage of the cases expressing S100A4 in carcinoma tissues. (c) Average tumor size in HCC patients with different S100A4 protein levels. * P < .05. (d) Percentage of tissues with negative, low and high S100A4 expression with different tumor grades. (e) Serum S100A4 levels in healthy donors (n = 20) and HCC patients (n = 20) were detected by ELISA. *** P < .001. (f) Immunohistochemical staining including H&E, S100A4 and Sirius Red staining of adjacent tissue sections of human HCC tissues. (g) S100A4 expression in mouse models of HCC. Adjacent sections of HCC tissues were stained for S100A4, Sirius Red and ER-TR7 in C57BL/6 mice treated with DEN for 8 months, C57BL/6 mice treated with DEN and CCl4 for 8 months, and C57BL/6 mice treated with DEN and anti-CD137 agonist antibody (2A) for 8 months. Scale bar, 100 μm
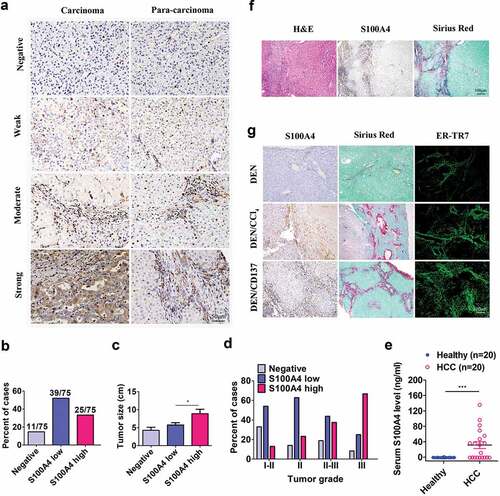
Figure 2. S100A4+ cells accumulate during the development of HCC, and they are a subpopulation of macrophages. (a) Schematic representation of the DEN/CCl4-induced liver fibrosis-related HCC experiment. Groups of mice (3/group) were left untreated (control) or were treated i.p. with a single injection of 50 μg/g of DEN at 15 days old and were treated with CCl4 twice weekly for 8 weeks 1 month later. Liver tissues were harvested at the indicated timepoints after the final injection. (b) Histological characterization of liver fibrosis and S100A4+ cell accumulation. Adjacent sections were stained with H&E, anti-S100A4 and Sirius Red. Representative images are shown for untreated control and CCl4-treated mice at each time point. Scale bar, 50 μm. (c) Quantification of areas stained with Sirius Red. Statistical analysis was performed between the control and CCl4-treated groups (n = 3). Results represent three independent experiments; mean ± SEM, n = 5 mice per group. * P < .05. (d) S100A4+/+ GFP transgenic mice were administered DEN/CCl4 as described above. Total cell numbers of GFP+ cells in the liver (calculated by multiplying the absolute liver nonparenchymal cell number by the percentage of GFP+ cells) of untreated (control) and CCl4-treated mice at each time point are shown. * P < .05. (e) Double staining for S100A4 (green) and F4/80, CD11b and CD68 (red) in liver, mouse HCC and human HCC tissues. Typical double staining positive cells were indicated by arrows. Scale bar, 50 μm. (f) Percentages of double staining positive S100A4+ cells in HCC tissues. (g-h) Flow cytometry analysis of the phenotypes of S100A4+ cells in the liver of S100A4+/+GFP mice treated with CCl4 by staining GFP+ cells with CD11b and F4/80 antibodies. (g) Representative images of three independent experiments showed S100A4+ cells in the liver of CCl4 treatment. (h) Statistic analysis of CD11b+S100A4+ or F4/80+S100A4+ cells in S100A4+ (GFP+ cells) cells
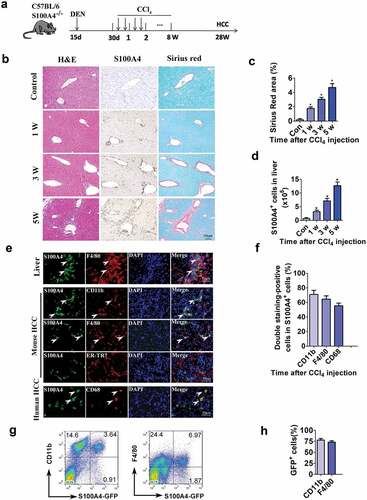
Figure 3. S100A4 deficiency attenuates liver fibrosis and DEN/CCl4-induced carcinogenesis. (a) Schematic illustration of the DEN/CCl4-induced HCC model. Fifteen-day-old WT littermates and S100A4−/- mice (n = 8) were treated i.p. with a single injection of 50 μg/g DEN and 1 month later were treated with CCl4 twice weekly for 2 months. All mice were euthanized 8 months after DEN treatment for further analysis. (b) Representative photographs of the livers from the animals in each group at 8 months of age. (c-e) The tumor number, maximal tumor size and weight of liver are shown. *** P < .001. (f) Liver sections of HCC were stained with H&E, S100A4, Sirius red and α-SMA. Scale bar, 100 μm. * P < .05, ** P < .01
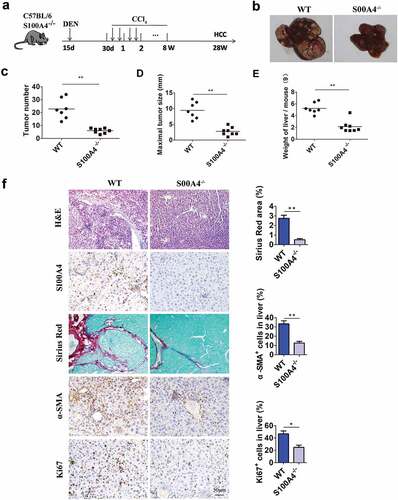
Figure 4. Higher expression of stem cell markers in HCC is associated with liver fibrosis. (a) Representative images of Sirius Red staining of human and mouse HCC tissues. (b) DEN/CCl4-induced HCC sections from WT littermates and S100A4−/- mice were stained with CD34 and CD44. Scale bar, 100 μm. (c) Double staining for CD34/CD44 (red) and S100A4 (green). DEN/CCl4-induced HCC tissues were harvested and stained with anti-CD34/CD44 and anti-S100A4. White arrows indicate the adjacent CD44/CD34+ cells and S100A4+ cells. Scale bar, 50 μm. (d) Staining for CD34/CD44 and ER-TR7. Scale bar, 50 μm
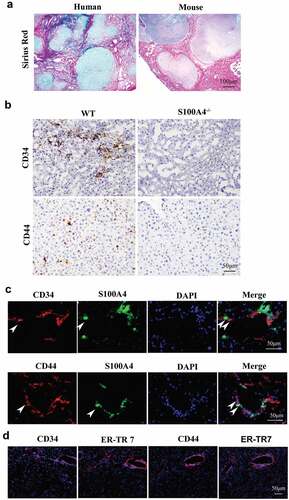
Figure 5. Upregulation of stem cell-associated genes in Huh-7 cells cultured in collagen I medium with S100A4. (a) Stem cell marker expression in Huh-7 cells. Huh-7 cells were cultured in collagen I medium or without collagen I medium and incubated with or without S100A4 (200 ng/ml) for 5 days; then, cell mRNA was extracted and used for the detection of OCT-4, SOX2, CD44 and Nanog mRNA expression by RT-PCR. Three independent experiments showed similar results. (b) Stem cell markers expression in Huh-7 cells was quantified by real-time PCR. Cells treated as described above were collected and analyzed for the expression of OCT-4, SOX2, CD44 and Nanog by real-time PCR. ** P < .01. (c-d) Huh-7 tumor spheroid formation after 3 days in culture treatment with collagen I and S100A4. ** P < .01. (e) Tumorigenicity of collagen I and S100A4-cultured Huh-7 cells in nude mice. Cells were treated as described above for 5 days. They were then subcutaneously injected into nude mice with 5 × 10⁵, and tumor formation was observed as described in methods
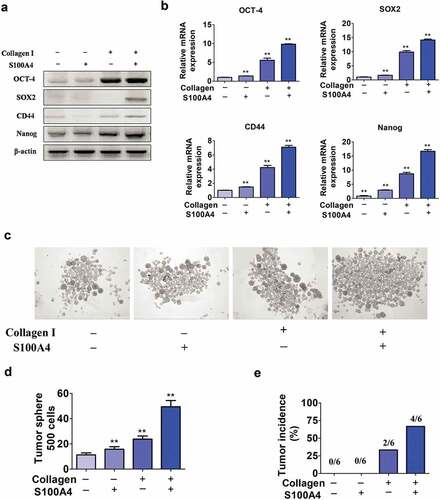
Figure 6. S100A4 upregulates stem cell-associated genes in collagen I-cultured Huh-7 cells through β-catenin signaling. (a) Levels of p-p65, p-Erk and p-β-catenin in Huh-7 cells were determined by western blot analysis. Huh-7 cells were cultured without collagen I and incubated with or without S100A4 (200 ng/ml) as indicated. (b) Levels of p-p65, p-Erk and p-β-catenin in Huh-7 cells were upregulated upon administration of collagen I and S100A4, determined by western blot. Huh-7 cells were cultured with collagen I and incubated with or without S100A4 (200 ng/ml) as indicated. (c) Western blot analysis of protein levels of p-β-catenin in DEN/CCl4-treated liver tissues and tumor tissues from S100A4−/- and WT littermates. (d) Sections of β-catenin expression was detected upon S100A4 and collagen I administration by immunofluorescence, representative images were shown. (e) Levels of p-β-catenin in Huh-7 cells were determined by western blot analysis. Huh-7 cells were cultured with collagen I and incubated with S100A4 (200 ng/ml) or a β-catenin inhibitor for 12 h. (f) Expression of OCT-4, SOX2, CD44 and Nanog in Huh-7 cells by real-time PCR. The upregulated effect of S100A4 was abolished upon administration of β-catenin inhibitors. *P < .05, ** P < .01
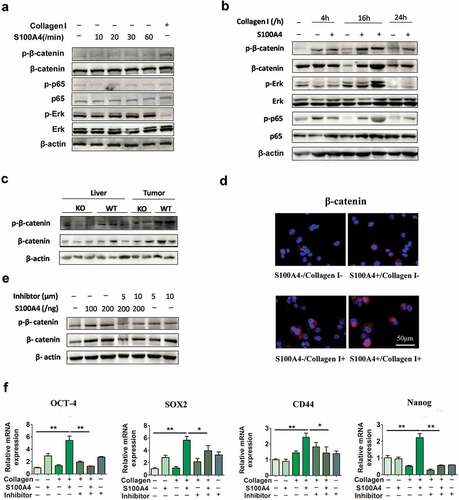
Figure 7. S100A4 induced β-catenin signaling in collagen I cultured Huh-7 cells was RAGE dependent. (a) The expression of RAGE in HCC cells was upregulated after collagen treatment. Huh-7 cells were cultured with or without collagen I and incubated with S100A4 (200 ng/ml) for different time as indicated. Levels of RAGE in Huh-7 cells were determined by western blot. (b) Huh-7 cells were cultured as (a) described, levels of p-β-catenin in Huh-7 cells were determined by western blot analysis. (c) Huh-7 cells were cultured as (a) described, RAGE inhibitor FPS-ZM1 (75 nmol/μl) was added or not, levels of p-β-catenin were determined by western blot analysis. (d) The expression of OCT-4, SOX2, CD44 and Nanog in Huh-7 cells were detected by real-time PCR. * P < .05, ** P < .01, *** P < .001
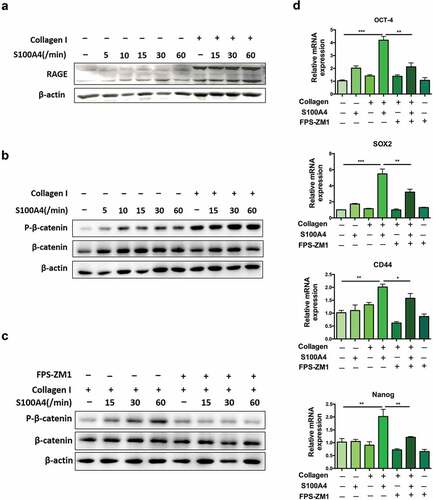
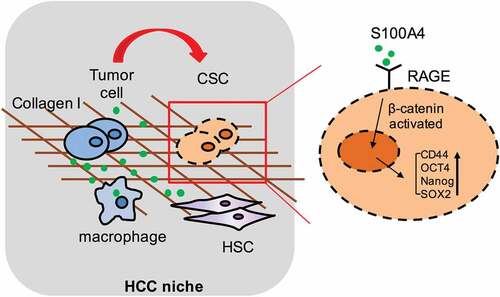
Figure 8. Schematic summary for the role of S100A4 in promoting fibrosis-related hepatocarcinogenesis through the crosstalk between macrophage-associated S100A4, fibrotic lesion and HCC stem cells