Figures & data
Figure 1. Development of a novel hTERT promoter-regulated oncolytic HSV-1 virus (OVH) with selective oncolytic capability. (A) Schematic diagram of KOS and KOS-derived HSV-1 recombinant constructs (dICP0, OVN and OVH) used in this study. (B) Western blot analysis of ICP0 and ICP34.5 expression in various infected U-2 OS cells 48 h after virus infection. (C-D) Western blot analysis of ICP27 and ICP4 expression in various infected human normal cell lines (HUVECs, L-02 and HEL299) (C) and human tumor cell lines (MCF-7, Hep3B and H1299) (D) 3 h, 6 h, and 9 h after virus infection. (E) Viral replication assays were performed on various infected cell lines (MOI = 1 PFU/cell). Viruses harvested from infected cells 48 h after virus infection were titrated. Fold changes between groups were calculated and shown. (F) Cell viability was measured in various infected cell lines 72 h after virus infection (MOI = 1 PFU/cell). Remaining cells harvested from individual virus infected cells were measured by trypan blue exclusion method. Values are means of three independent experiments, data are shown as means ± SEM. *P < .05, ***P < .001, ****P < .0001, ns, not significant by one-way ANOVA test for F
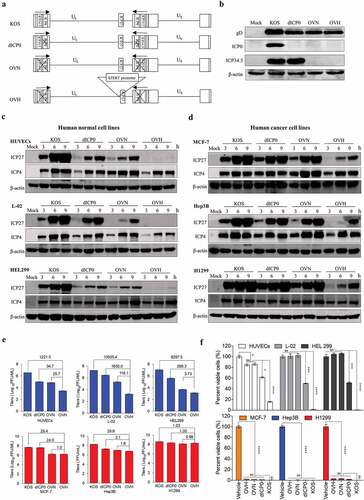
Figure 2. Safety evaluation of OVH in vivo. (A) Murine lethal challenge model and timeline of challenge and follow-up. (B) Survival over time for mice intracerebrally (i.c.) injected with indicated dosages of viruses or PBS in 10 μl. (C) The replication efficiency of KOS, dICP0, OVN and OVH in U-2 OS cells exposed to different doses of ganciclovir (0 ng/mL~1000 ng/mL, MOI = 0.05 PFU/cell). (D) Timeline of the toxicity study. Complete blood count (CBC) analysis and immunohistochemistry (IHC) analysis were performed at indicated time points. (E-J) Mice intravenously injected with a single dose of OVH (5 × 10⁷ PFU) were bled on day 1 and day 30 post-injection, and WBC, PLT, lymphocytes, RBC and neutrophil granulocytes were measured, n = 6 BALB/c mice per group. H&E staining of representative tissue sections from vehicle- and OVH-injected mice on day 30 following virus injection (E). H&E images were obtained using a microscope (OLYMPLUS), with a 20 × objective. (K) The body weight of the treated mice was monitored over a 30-day period. (l) Timeline of biochemistry analysis after mice were intravenously challenged with 5 × 10⁷ PFU OVH or PBS. (M-T) ALB, TP, CREA, UA, UREA, and T-Bil levels as well as AST and ALT activity were measured, n = 10 BALB/c mice per group. Arrows indicate corresponding time points. Data are shown as means ± SEM. **P < .01, ns, not significant by unpaired two-tailed Student’s t tests for E, F, G, I, J or repeated measure ANOVA for K, M-T
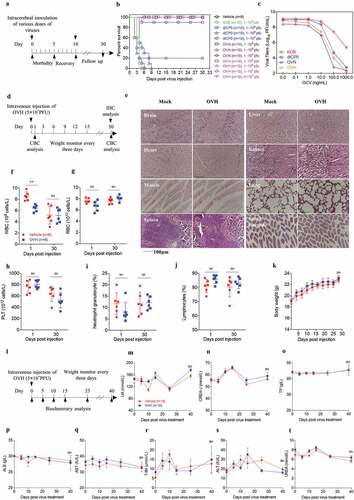
Figure 3. Oncolytic efficacy of OVH in vitro and in vivo. (A) Cell viability assay was performed on a panel of human tumor cell lines 72 h after virus infection (MOI = 1 PFU/cell). (B) Viral titers in selected infected cell lines exhibiting high sensitivity (HS, n = 13), sensitivity (S, n = 6) and refractory (R, n = 3) to OVH. (C) Timeline of treatment in BALB/c nu/nu mice. Arrows indicate corresponding time points. (D-H) Growth of vehicle- or OVH-treated tumor xenografts in nude mice. Mice were subcutaneously (s.c.) inoculated with H1299 (D), Hep3B (E), CEN2 (F), MCF-7 (G) or HCT116 (H) cells in the left flank and treated d days later with OVH. Tumor growth was monitored over a 24 ~ 30-day period. In D, E, d = 30; in F, G, H, d = 14. (I-L) Two human primary tumor cell lines were isolated from surgical tumor specimens of glioma and ovarian cancer patients and infected with OVH (MOI = 1) or vehicle for 72 h. Oncolytic efficacy of OVH against glioma in vitro (I) and in vivo (J) was observed. Oncolytic efficacy of OVH against ovarian cancer in vitro (K) and in vivo (L) was observed. In J, L, d = 14. The number of mice (N) used in the experiments is shown in the individual figures. All values are presented as the mean ± SEM. *P < .05, **P < .01, ***P < .001, ****P < .0001, ns, not significant by one-way ANOVA test for B, unpaired two-tailed Student’s t tests for I, K or repeated measure ANOVA for D-H, J, L
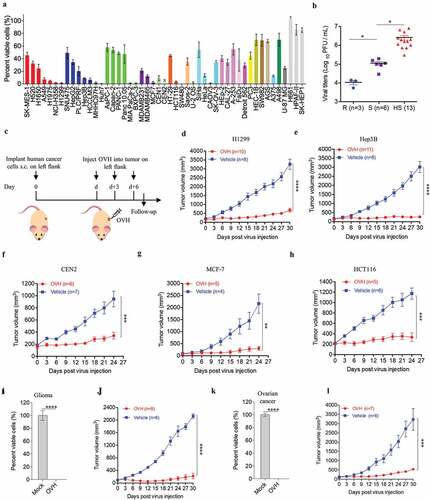
Figure 4. OVH therapy can eradicate local and distant tumors in the immunogenic tumor models. (A, D, G) Timeline of treatment in C57BL/6 and BALB/c mice. Mice were s.c. inoculated with Hepa1-6 (A), Renca (D) or A20 cells (G) in both flanks, and treated 10 or 12 days later with OVH or vehicle. (B) Tumor growth of virus-injected (right flank) Hepa1-6 tumors. (C) Growth of distant (left flank) Hepa1-6 tumors. (E) Tumor growth of virus-injected Renca tumors. (F) Tumor growth of distant Renca tumors. (H) Tumor growth of virus-injected A20 tumors. (I) Tumor growth of distant A20 tumors. (J-M) The subset of cured long-term survivors from the Hepa1-6 model (K), Renca model (l), and A20 model (M) groups, together with naïve mice, were re-challenged with 1 × 10⁷ of the corresponding tumor cells. The percentage of long-term survivors that rejected the secondary challenge was calculated. (N) A subset of cured long-term survivors from the Renca model and A20 model groups were re-challenged with 1 × 10⁷ Renca tumor cells. The percentage of long-term survivors that rejected secondary challenge was calculated. (O) Western blot analysis of Hepa1-6 cell lysate and Renca cell lysate with serum from OVH-treated C57BL/6 mice bearing Hepa1-6 tumors or naïve mice. (P) Western blot analysis of Hepa1-6 cell lysate and Renca cell lysate with serum from OVH-treated BALB/c mice bearing Renca tumors or naïve mice. The number of mice (N) used in the experiments is shown in individual figures. All values are presented as the mean ± SEM. **P < .01, ***P < .001, ****P < .0001 by repeated measure ANOVA for B, C, E, F, H, I or unpaired two-tailed Student’s t tests for K-N
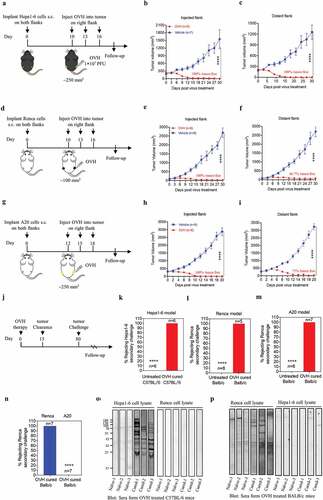
Figure 5. OVH triggers immunogenic cell apoptosis in susceptible tumor cells. (A) Determination of the levels of apoptosis in HeLa, H1299, HCT116 and CEN2 cell lines left uninfected or infected with OVH at an MOI of 0.5 PFU/cell for 48 h using annexin-V/PI-labeled flow cytometry. Graphs represent pooled data from three independent experiments. (B) Western blot analysis of the expression of full-length and cleaved caspase-8, caspase-3 and PARP in infected HeLa, H1299, HCT116 cell lines at 48 h after virus infection. (C-E) HeLa, H1299, HCT116 and CEN2 cell lines were either left uninfected or infected with OVH at an MOI of 1 PFU/cell. Cells and supernatants were harvested at 48 h post-infection. The surface expression of calreticulin was determined by flow cytometric analysis of the cells (C), and the levels of released ATP (D) and HMGB1 (E) were determined by analysis of the supernatants. (F-G) H&E and IHC analysis of an apoptotic marker (cleaved-caspase3) and proliferation marker (Ki67) in human xenograft HeLa tumors (F) and CEN2 tumors (G) at 24 h after receiving intratumoral injection of two doses of OVH (1 × 10⁷ PFU per dose) or vehicle. (H) Mice were s.c. inoculated with Hepa1-6 cells in both flanks and received intratumoral injection of a single dose of OVH on the right flank (1 × 10⁷ PFU per dose) or vehicle. H&E and IHC analysis of an apoptotic marker (cleaved-caspase3) and proliferation marker (Ki67) in both flanks of Hepa1-6 xenografts (virus-injected tumor and distant tumor) at 5 days after treatment. H&E and IHC images were obtained using a microscope (OLYMPLUS), with indicated objectives. Values are the means of three independent experiments, data are shown as means ± SEM. **P < .01, ***P < .001, ****P < .0001, ns, not significant by unpaired two-tailed Student’s t tests
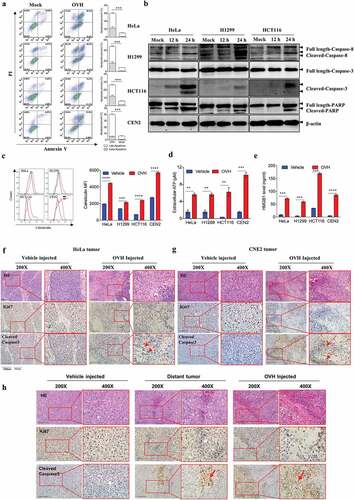
Figure 6. OVH-induced oncolysis elicits efficacious humoral response against tumors. (A) Timeline of the serum transfusion experiment. Arrows indicate corresponding time points. (B) Overview of serum used for antibody depletion experiments. Sera A or B were collected 21 days after vehicle or OVH treatment, separately. Sera C was generated by filtering sera B through an IgG removal protein A/G beads. (C-F) Sera A, B and C (0.3 ml) from Hepa1-6 model mice were transferred into naïve recipients pre-implanted with Hepa1-6 tumors. Tumor growth (C) and body weight (D) of the treated mice were monitored over a 30-day period. (G-J) Sera A, B and C (0.3 ml) from Renca model mice were transferred into naïve recipients pre-implanted with Renca tumors. Tumor growth (G) and body weight (H) of the treated mice were monitored over a 21-day period. (K-N) Sera A, B and C (0.3 ml) from A20 model mice were transferred into naïve recipients pre-implanted with A20 tumors. Tumor growth (K), and body weight (L) of the treated mice were monitored over a 20-day period. Tumors from each tumor model were dissected and weighed at experiment termination (E, F, I, J, M, N). All values are presented as the mean ± SEM. **P < .01, ns, not significant by repeated measure ANOVA (C, G, K) or by one-way ANOVA (E, I, M)
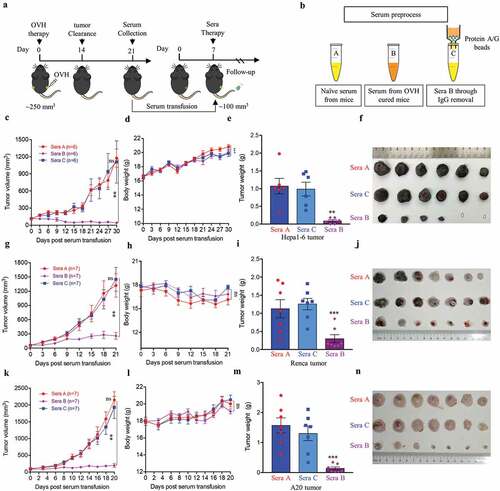
Figure 7. B cells were required for maximal antitumor efficacy of oncolytic virotherapy. (A, B) Evaluation of the antitumor effects of OVH therapy was carried out in wild-type C57BL/6 (B6) and JHT mice. Mice were s.c. inoculated with Hepa1-6 cells in both flanks and treated 10 days later and every 3 days thereafter until the total two dosages were finished, with OVH or vehicle. Black arrow indicates virus injection. Tumor growth of virus-injected (A) and distant (B) Hepa1-6 tumors. (C) Tumor growth of distant Hepa1-6 tumors in OVH-treated B6 and JHT mice. (D-G) The tumors in both flanks from each group were dissected and weighed at experiment termination (F, G). Tumor weight of virus-injected tumors (D) and distant tumors (E). All values are presented as the mean ± SEM. *P < .05, ***P < .001, ****P < .0001, ns, not significant by repeated measure ANOVA (A, B) or by one-way ANOVA (D, E)
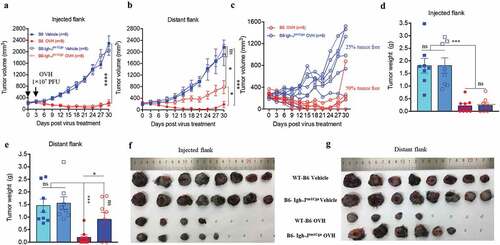
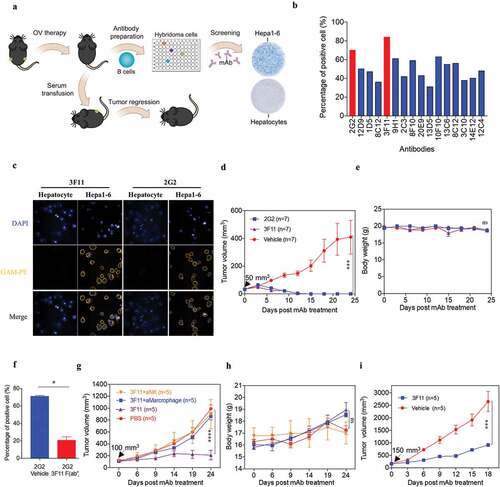
Figure 8. OVH therapy induces endogenous tumor-specific antibody responses. (A) Schematic diagram of Hepa1-6-specific mAb generation from OVH-cured Hepa1-6 mice. (B) Sixteen mAbs were selected from C57BL/6 spleen×sp2/0 hybridomas, which specifically recognized Hepa1-6 tumor cells and did not cross-react with mouse primary hepatocytes. (C) Hepa1-6 cells and mouse primary hepatocytes were stained with each mAb (3F11 or 2G2) and PE conjugated anti-mouse IgG (Fc specific) antibody, then analyzed by flow cytometry. Representative images of cells stained with each mAb were shown. (D, E) Evaluation of the antitumor effects of 3F11 and 2G2. Tumor growth (D) and body weight (E) were monitored over a 24-day period. (F) Competitive binding assay between 3F11 and 2G2 against Hepa1-6 cells. Hepa1-6 cells were incubated with 2G2 and 3F11 F (ab’)2, then stained with PE conjugated anti-mouse IgG (Fc specific) antibody and analyzed by flow cytometry. (G) Tumor growth was monitored after depleting antibodies specific for the indicated surface markers (n = 5 mice per group). (H) Body weight was monitored over a 24-day period. (I) Evaluation of the antitumor effects of 3F11. Tumor growth was monitored over an 18-day period. Black arrow indicates initial tumor volume for treatment. All values are presented as the mean ± SEM. *P < .05, ***P < .001, ****P < .0001, ns, not significant by repeated measure ANOVA (D, E, G, H, I) or by unpaired two-tailed Student’s t tests (F)