Figures & data
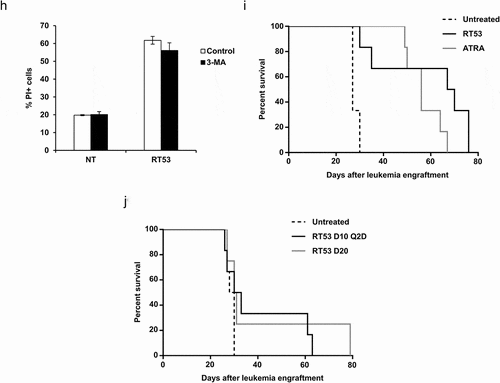
Figure 1. RT53 treatment increases APL mice survival. (a) The indicated cells were left untreated or exposed to increasing concentrations of RT53 for 20 h. Cell death induced by peptide treatment was measured by lactate dehydrogenase (LDH) release. Data are means ± s.e.m. (n = 3). (b) Ultrastructural analysis of RT53-treated spleen cells. Spleen cells from healthy or APL mice were left either untreated or exposed to 10 µM of RT53 for 1 h. Cells were then analyzed by transmission electron microscopy following osmium tetroxide staining. (c) APL spleen cells were exposed to 5 µM RT53 for the indicated periods of time and phosphatidylserine exposure (annexin V labeling) and cell membrane permeabilization (propidium iodide (PI) labeling) were analyzed by flow cytometry. The percentages of viable cells (annexin V−/PI−), early apoptotic cells (annexin V+/PI−) and late apoptotic/necrotic cells (annexin V+/PI+) are represented (average of two independent experiments). (d) APL spleen cells were exposed to 5 µM of RT53 in the presence or absence of 50 μM zVAD-fmk for 3 h. Cell death was measured by flow cytometry as in (c). Staurosporine (5 µM) was used as a control. Average of two independent experiments. (e) APL spleen cells were exposed to 5 µM of RT53 in the presence or absence of 50 μM Necrostatin-1 (Nec-1) for 3 h and cell membrane permeabilization (PI labeling) was analyzed by flow cytometry. [TNF-α (30 ng/ml) + zVAD-fmk (40 μM) + 10 µg/mL cycloheximide (CHX)] treatment was used as a control. (f) APL spleen cells were exposed to 5 µM of RT53 in the presence or absence of 10 μM of IM-54 for 3 h. Cell death was measured as in (e). H2O2 (100 µM) treatment was used as a control. Average of two independent experiments. (g) APL spleen cells were exposed to 5 µM RT53 for 1 h in the presence or absence of 10 µM 3-Methyladenine (3-MA) and autophagic activity was determined by flow cytometry analysis using the Cyto-ID autophagy detection reagent. Serum starvation (1 h) was used as a control. Data are expressed as the mean fluorescence intensity of Cyto-ID (average of two independent experiments). (h) APL spleen cells were exposed to 5 µM of RT53 for 1 h in the presence or absence of 10 µM 3-Methyladenine (3-MA). Cell death was measured as in (e). Average of two independent experiments. (i) 104 APL blasts were inoculated intravenously (i.v.) into FVB/N mice at day 0. Mice were then either left untreated (n = 6), treated with ATRA (5 mg, subcutaneous implantation of 21-day release pellets, n = 6) at day 6 or injected intraperitoneally (i.p.) with RT53 (2.4 mg/kg in normal saline) at day 10 every day for a total of seven doses (n = 6). Survival curves were analyzed with the Mantel–Cox test. (j) APL mice obtained as in (i) were either left untreated (n = 6), injected i.p. with RT53 (2.4 mg/kg in normal saline) at day 10 every other day for a total of seven doses (D10 Q2D schedule, n = 6) or at day 20 every day for a total of seven doses (D20 schedule, n = 4). Survival curves were analyzed with the Mantel–Cox test
![Figure 1. RT53 treatment increases APL mice survival. (a) The indicated cells were left untreated or exposed to increasing concentrations of RT53 for 20 h. Cell death induced by peptide treatment was measured by lactate dehydrogenase (LDH) release. Data are means ± s.e.m. (n = 3). (b) Ultrastructural analysis of RT53-treated spleen cells. Spleen cells from healthy or APL mice were left either untreated or exposed to 10 µM of RT53 for 1 h. Cells were then analyzed by transmission electron microscopy following osmium tetroxide staining. (c) APL spleen cells were exposed to 5 µM RT53 for the indicated periods of time and phosphatidylserine exposure (annexin V labeling) and cell membrane permeabilization (propidium iodide (PI) labeling) were analyzed by flow cytometry. The percentages of viable cells (annexin V−/PI−), early apoptotic cells (annexin V+/PI−) and late apoptotic/necrotic cells (annexin V+/PI+) are represented (average of two independent experiments). (d) APL spleen cells were exposed to 5 µM of RT53 in the presence or absence of 50 μM zVAD-fmk for 3 h. Cell death was measured by flow cytometry as in (c). Staurosporine (5 µM) was used as a control. Average of two independent experiments. (e) APL spleen cells were exposed to 5 µM of RT53 in the presence or absence of 50 μM Necrostatin-1 (Nec-1) for 3 h and cell membrane permeabilization (PI labeling) was analyzed by flow cytometry. [TNF-α (30 ng/ml) + zVAD-fmk (40 μM) + 10 µg/mL cycloheximide (CHX)] treatment was used as a control. (f) APL spleen cells were exposed to 5 µM of RT53 in the presence or absence of 10 μM of IM-54 for 3 h. Cell death was measured as in (e). H2O2 (100 µM) treatment was used as a control. Average of two independent experiments. (g) APL spleen cells were exposed to 5 µM RT53 for 1 h in the presence or absence of 10 µM 3-Methyladenine (3-MA) and autophagic activity was determined by flow cytometry analysis using the Cyto-ID autophagy detection reagent. Serum starvation (1 h) was used as a control. Data are expressed as the mean fluorescence intensity of Cyto-ID (average of two independent experiments). (h) APL spleen cells were exposed to 5 µM of RT53 for 1 h in the presence or absence of 10 µM 3-Methyladenine (3-MA). Cell death was measured as in (e). Average of two independent experiments. (i) 104 APL blasts were inoculated intravenously (i.v.) into FVB/N mice at day 0. Mice were then either left untreated (n = 6), treated with ATRA (5 mg, subcutaneous implantation of 21-day release pellets, n = 6) at day 6 or injected intraperitoneally (i.p.) with RT53 (2.4 mg/kg in normal saline) at day 10 every day for a total of seven doses (n = 6). Survival curves were analyzed with the Mantel–Cox test. (j) APL mice obtained as in (i) were either left untreated (n = 6), injected i.p. with RT53 (2.4 mg/kg in normal saline) at day 10 every other day for a total of seven doses (D10 Q2D schedule, n = 6) or at day 20 every day for a total of seven doses (D20 schedule, n = 4). Survival curves were analyzed with the Mantel–Cox test](/cms/asset/318742b2-abae-47e3-838a-6ab70a8f8c3e/koni_a_1728871_f0001a_b.gif)
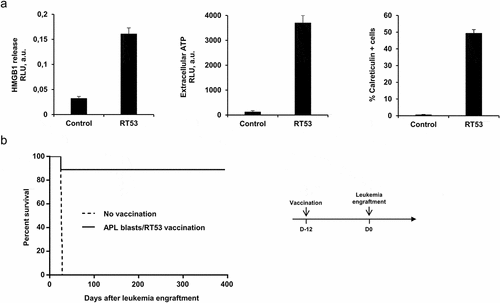
Figure 2. Inhibition of APL progression by prophylactic vaccination with RT53-treated APL blasts. (a) APL blasts in basal RPMI medium were left untreated or treated with either 5 μM of RT53 for 6 h (CRT exposure analysis) or 10 µM of RT53 for 1 h (HMGB1 and ATP release analysis). Extracellular HMGB1 (left) and ATP (middle) were then measured in the culture supernatant by ELISA and ATP-bioluminescence assays, respectively, and surface exposure of CRT (right) detected by FACS analysis. (b) APL blasts were exposed to 30 µM RT53 in basal RPMI medium for 3 h for cell death induction and the whole suspension was injected subcutaneously (2 × 10⁶ cells) into the left flanks of FVB/N mice. Twelve days later, the vaccinated (n = 8) or control mice (n = 7) were injected i.v. with live 104 APL blasts. Survival curves were analyzed with the Mantel–Cox test. The schematic protocol used is illustrated (right)

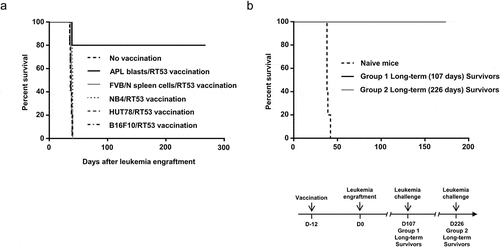
Figure 3. Tumor specificity and long-lasting effect of prophylactic vaccination with RT53-treated APL blasts. (a) FVB/N mice were vaccinated with RT53-treated APL blasts (n = 10), RT53-treated spleen cells from healthy mice (n = 5), or the indicated RT53-treated cells (n = 5 per group) using the same protocol as in . Twelve days later, the vaccinated or control mice were injected i.v. with live 104 APL blasts. Survival curves were analyzed with the Mantel–Cox test. (b) Surviving mice from were challenged with 104 live APL spleen blasts 107 days (group 1, n = 5) or 226 days (group 2, n = 4) after initial APL engraftment. Survival curves were analyzed with the Mantel–Cox test. The schematic protocol used is illustrated (lower panel)

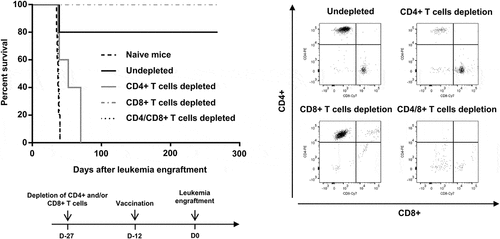
Figure 4. Requirement of CD4+ and CD8 + T cells for prolonged survival induced by vaccination with RT53-treated APL blasts. FVB/N mice were depleted of either CD4+, CD8+ or both T cell populations by bi-weekly i.p. injection of 0.2 mg of T cell type-specific monoclonal antibodies starting 2 weeks before experiments. Injections were then performed 2 times per week during the study period. The efficacy of depletion was monitored by flow cytometric analysis (right panel). Depleted (n = 5 per group) or naive mice (n = 10) were then vaccinated with RT53-treated APL blasts and injected i.v. with live 104 APL blasts (left, upper panel). Survival curves were analyzed with the Mantel–Cox test. The schematic protocol used is illustrated (left, lower panel)

Figure 5. Therapeutic efficacy of RT53-treated APL blast vaccination in well-established leukemia. 104 APL blasts were inoculated i.v. into FVB/N mice at day 0. Mice were then vaccinated with RT53-treated APL blast 3 or 10 days after leukemia engraftment (n = 5 per group). Survival curves were analyzed with the Mantel–Cox test. The schematic protocol used is illustrated (right panel)


