
Figures & data
Figure 1. PD-L1 is overexpressed in CSCs subpopulation of breast cancer cells. PD-L1 expression level in both CSC-like subpopulation and their differentiated-like counterparts in five breast cancer cell lines as identified by phenotype using two different sets of markers: a) commonly used CSCs set of markers: EP-CAM+/CD44high/CD24low to identify CSC-like cells and CD44low/CD24high for differentiated-like cells and b) the alternative phenotype Ep-CAM+/CD90high to identify CSC-like and CD90low for differentiated-like cells. Results are displayed as the average of Mean florescence intensity (MFI) of four independent experiments ± SEM. * indicates statistical significance (p < .05)
Figure 2. PD-L1hi cells have stem-like features Stemness features of PD-L1hi and PD-L1lo cells sorted MDA-MB-231 cells were assessed by qPCR (a) using CD44 and CD24 expression levels as markers of CSCs and PD-L1 was used as a control for the cell sorting, or functionally by either (B&C) tumorsphere formation ability in vitro or (d) tumor formation and growth in Nude mice. In A, B & C results were normalized on PD-L1lo cells. Experiments were conducted at least three times and displayed as mean ± SEM. *,** indicates statistical significance * = p value <.05, ** = p value <.001. For limiting dilution tumor formation assay (D), three different cell dilutions (5,100,500) of sorted PD-L1hi and PD-L1lo cells were injected into Nude mice. After injection, both tumor formation and tumor sizes were monitored for 9 weeks starting from week5, when the tumor became noticeable
Figure 3. PD-L1 is overexpressed in breast cancer cells though Notch, MAPK/ERK, and/or PI3K/AKT pathways. a) PD-L1 expression level, as measured by flow cytometry, in CSC-like cell subpopulation and their differentiated-like counterparts of MDA-MB-231 breast cancer cells upon treatment with specific inhibitors for stem cell-related pathways. Results are displayed as the mean MFI of, at least, five independent experiments (Mean± SEM) of PD-L1 expression after 24-h incubation with pathway inhibitors. *,** indicates statistical significance * = p value <.05, ** = p value <.001. Significance was tested using paired student T-test for difference in PD-L1 expression upon treatment with pathway inhibitors as compared with untreated cells. b) PD-L1 expression in CSC-like cell subpopulation and their differentiated-like counterparts upon treatment with notch inhibitor in two additional breast cancer cell lines: SUM149 and HCC1937 as well as normal-like human mammary luminal (HMLE) cells. c) Tumorsphere formation assay for sorted PD-L1hi and PD-L1lo upon treatment with notch inhibitor as compared with untreated control. d&e) PD-L1 expression level, as measured by flow cytometry after treatment with notch pathway inhibitor II (RO4929097) (d) or treatment with specific notch ligands (DLL-1, 1500 nM or Jag1, 1 µg/mL) (e) as compared with untreated control. Results in b, c, d & e are displayed as the mean of at least three independent experiments (Mean± SEM) of PD-L1 expression after 24-h incubation with inhibitor. * = p value <.05. Significance was tested for difference in PD-L1 expression in CSC-like subpopulations upon treatment as compared with untreated cells
Table 1. Cancer stem cell-related pathways inhibitors
Figure 4. PD-L1 is expressed on CSC-like cells through Notch3 activation. a) Expression levels of Notch 1, 2 and 3 in PD-L1hi and PD-L1lo sorted fractions of MDA-MB-231 cells as measured by qPCR. Results are from at least two independent sortings, error bars represent mean ± SEM. b&c) PD-L1 expression in different cell subpopulations of MDA-MB-231 upon knockdown of different notch receptors using specific SiRNA (b) or knockdown of notch3 (c) in the presence/absence of the notch ligand Jag1 or notch II inhibitor. Significance was tested for a difference in PD-L1 expression in CSC-like subpopulations as compared with untreated control cells (Si Cont). d) Western blot showing Notch3 expression in PD-L1hi and PD-L1lo sorted MDA-MB-231 cells. Cells were collected from multiple sortings to generate a blot. Results are displayed as the mean of six independent experiments (Mean± SEM). E) PD-L1 expression in subpopulations of MDA-MB-231 cells transfected either with GFP-tagged notch3 ORF or GFP tag empty vector (EV). Data are displayed as means of five different experiments ± SEM. * = p value <.05 and indicated statistical significance. Representative dotplots for one of the experiments are presented in supplementary figure 8
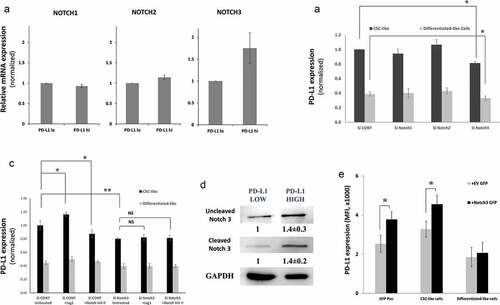
Figure 5. Notch upregulates PD-L1 through mTOR pathway. a) PD-L1 expression assessed by flow cytometry (MFI) in different cell subpopulation of MDA-MB-231 cells upon STAT3, c-Myc or mTOR knockdown using specific SiRNA. B&C) mTOR pathway activation upon treatment with notch inhibitor, MAPK/ERK inhibitor or PI3K/AKT inhibitor measured by: b) quantitative immunofluorescence of phosphorylated mTOR with representing images on top. c) phosphorylated and total 4E-BP1, S6 or ERK proteins as measured by western blot (left) with quantification (mean ± SEM) of blots from 3 different experiments (right). d) PD-L1 expression in different cell subpopulations of mTOR knocked down MDA-MB-231 breast cancer cells (Si-mTOR) compared with the scrambled ShRNA control (Sh-CONT) cells in the presence or absence of notch inhibitor
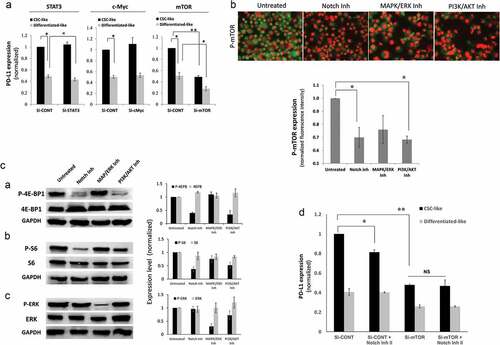
Figure 6. Notch3 upregulates PD-L1 through mTOR pathway. a) Bar graph showing the expression level (measured as MFI) of phosphorylated (S235/236) ribosomal protein S6 of MDA-MB-231 cells upon treatment with notch inhibitor II (RO4929097) in Notch3 knockdown (Si-Notch3) or scrambled control SiRNA (Si-Cont) as measured by immunofluorescence and quantified using BD pathway 855 system. b) Representative immunofluorescence images of cells (at x200 magnification) from one of the replicates in A
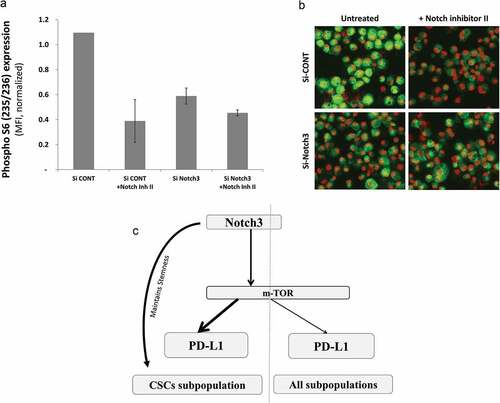
Table 2. Cancer stem cell-related pathways inhibitors